Unlock a world of possibilities! Login now and discover the exclusive benefits awaiting you.
- Qlik Community
- :
- All Forums
- :
- QlikView
- :
- SQL Running
- Subscribe to RSS Feed
- Mark Topic as New
- Mark Topic as Read
- Float this Topic for Current User
- Bookmark
- Subscribe
- Mute
- Printer Friendly Page
- Mark as New
- Bookmark
- Subscribe
- Mute
- Subscribe to RSS Feed
- Permalink
- Report Inappropriate Content
SQL Running
Hello All
I need your help urgently in the below query. I am missing something important. Please guide me
Below is the query where I am using the cumulative one. But when I am using it in visualization, it again sum up via individual dates.
I want to calculate the cumulative via SQL Query and take that one in visualization directly.
LIB CONNECT TO 'TIGUNVMBGWL0011';
ACCOUNT:
LOAD
PGLD,
PMONTH,
CLN,
DIN,
MAN,
CUMULATIVE_SALES,
ALID;
SQL SELECT
CONVERT(VARCHAR(7),PGLD,126) AS PMONTH,
CLN,
DIN,
MAN,
SUM(ALID) OVER (ORDER BY PGLD ROWS UNBOUNDED PRECEDING) AS CUMULATIVE_ALID,
ALID
FROM tempdb.dbo."AT"
GROUP BY
CONVERT(VARCHAR(7),PGLD,126),
PGLD,
CLN,
DIN,
MAN,
ALID;
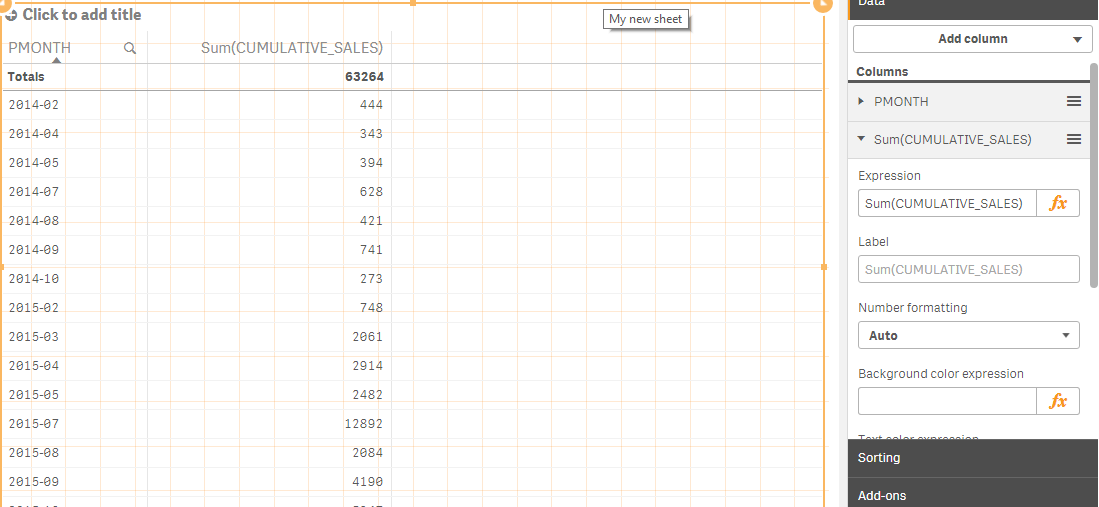
Kindly help me. Below attached screenshot of visualization and data file
Thanks
Deepanshu
- Mark as New
- Bookmark
- Subscribe
- Mute
- Subscribe to RSS Feed
- Permalink
- Report Inappropriate Content
Hi Seepanshu,
in your SQL statement, the CONVERT command with the parameter 126 converts your data to a full timestamp.
In order to create a Monthly chart in Qlik Sense, you can create a Calendar with all necessary calendar fields - Year, Month, Day, etc... There is plenty of information in the Community about the process of creating a calendar. Then, use the field MonthYear as a Chart Dimension.
Alternatively, if you load your data using the Data Manager and tag your date field as a Date, Qlik Sense will create an automated "calendar" using Derived Fields. You can use one of these fields for your chart.
This is quite a basic question. Perhaps you should consider taking a Qlik Sense class and cover the basics. If you can't take a class, then maybe you could learn the basics from one of the several Qlik books available in the market. For example, you can learn the basics and the advanced techniques for both QlikView and Qlik Sense from my book QlikView Your Business.
cheers,
Oleg Troyansky
- Mark as New
- Bookmark
- Subscribe
- Mute
- Subscribe to RSS Feed
- Permalink
- Report Inappropriate Content
Thanks for your reply Sir..
I already go through the basics of Qlik Sense. I know how to use the Master Calendar.
I try to use the master calendar but it fails... If you look the query I used Varchar(7) which means I restricting the data via month but still it does not work.
Might be this is the basic question for you not for everyone.
What I want is to calculate the running total in SQL query not in the visualization. The reason is that when I am using the running total in visualization I can not filter it on month or year or quarter basis.
Sir if for you the above question is basic.. Can you take 5-10 minutes and attach the qvf or qvd file where the above issue resolve. It would be grateful for me..
Thanks