Unlock a world of possibilities! Login now and discover the exclusive benefits awaiting you.
- Qlik Community
- :
- All Forums
- :
- QlikView App Dev
- :
- Displaying values - Combo chart on DataPoints
- Subscribe to RSS Feed
- Mark Topic as New
- Mark Topic as Read
- Float this Topic for Current User
- Bookmark
- Subscribe
- Mute
- Printer Friendly Page
- Mark as New
- Bookmark
- Subscribe
- Mute
- Subscribe to RSS Feed
- Permalink
- Report Inappropriate Content
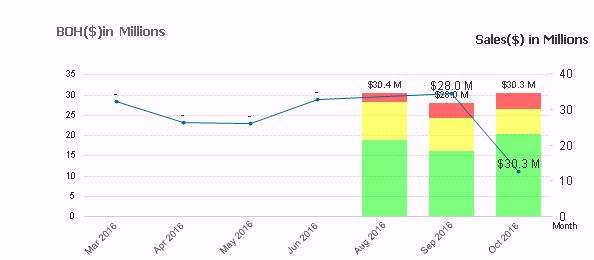
Displaying values - Combo chart on DataPoints
Hello,
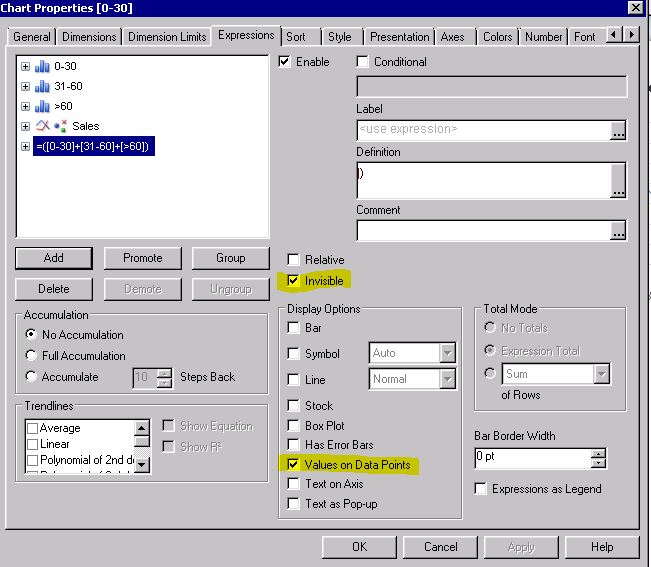
I want to display the Total values on top of each barwhich i have acheieved by using using an expression and making it invisible. However when i introduce a line graph, the values for the Bars are being shown for the line graph's data points which is wrong. Please help to resolve this issue.
- « Previous Replies
-
- 1
- 2
- Next Replies »
- Mark as New
- Bookmark
- Subscribe
- Mute
- Subscribe to RSS Feed
- Permalink
- Report Inappropriate Content
Try moving this expression for label above the expression for Sales and see if that helps. Also, have you made sure that you have no enabled the 'Values on Data Points' for the Sales expression?
- Mark as New
- Bookmark
- Subscribe
- Mute
- Subscribe to RSS Feed
- Permalink
- Report Inappropriate Content
Yes i tried all these possibilities, but no luck... Is there any work around?
Thanks.
- Mark as New
- Bookmark
- Subscribe
- Mute
- Subscribe to RSS Feed
- Permalink
- Report Inappropriate Content
Would you be able to share a sample where you can replicate the issue for us to play around with?
- Mark as New
- Bookmark
- Subscribe
- Mute
- Subscribe to RSS Feed
- Permalink
- Report Inappropriate Content
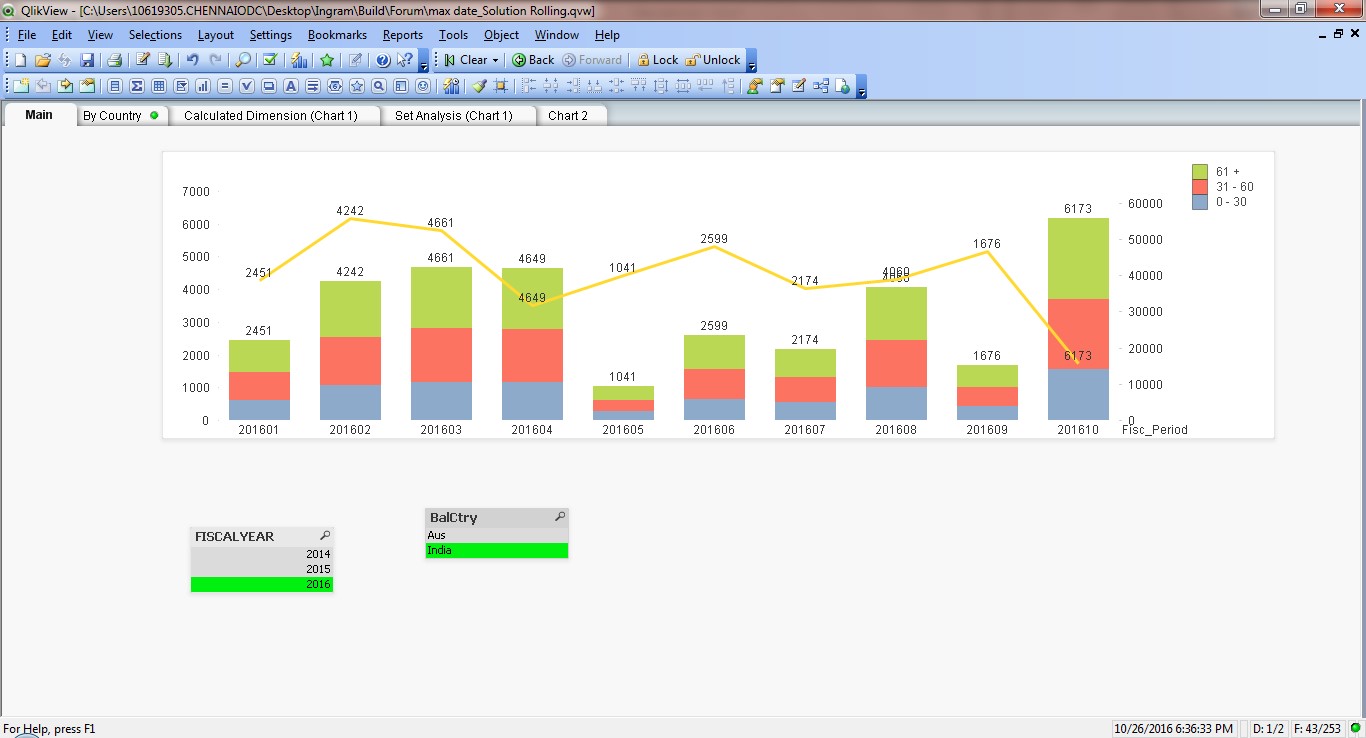
I have attached a sample application here. Please refer to the main tab.
Also i have a second question on the By Country tab in the application. My requirement is to display the bars for countries and the stacks should be the sellers with their % contribution, please give your suggestios on that too. Thanks.
- Mark as New
- Bookmark
- Subscribe
- Mute
- Subscribe to RSS Feed
- Permalink
- Report Inappropriate Content
I don't see any attachment, can you reattach please?
- Mark as New
- Bookmark
- Subscribe
- Mute
- Subscribe to RSS Feed
- Permalink
- Report Inappropriate Content
Yeah missed it, attached now. Please take a look.
- Mark as New
- Bookmark
- Subscribe
- Mute
- Subscribe to RSS Feed
- Permalink
- Report Inappropriate Content
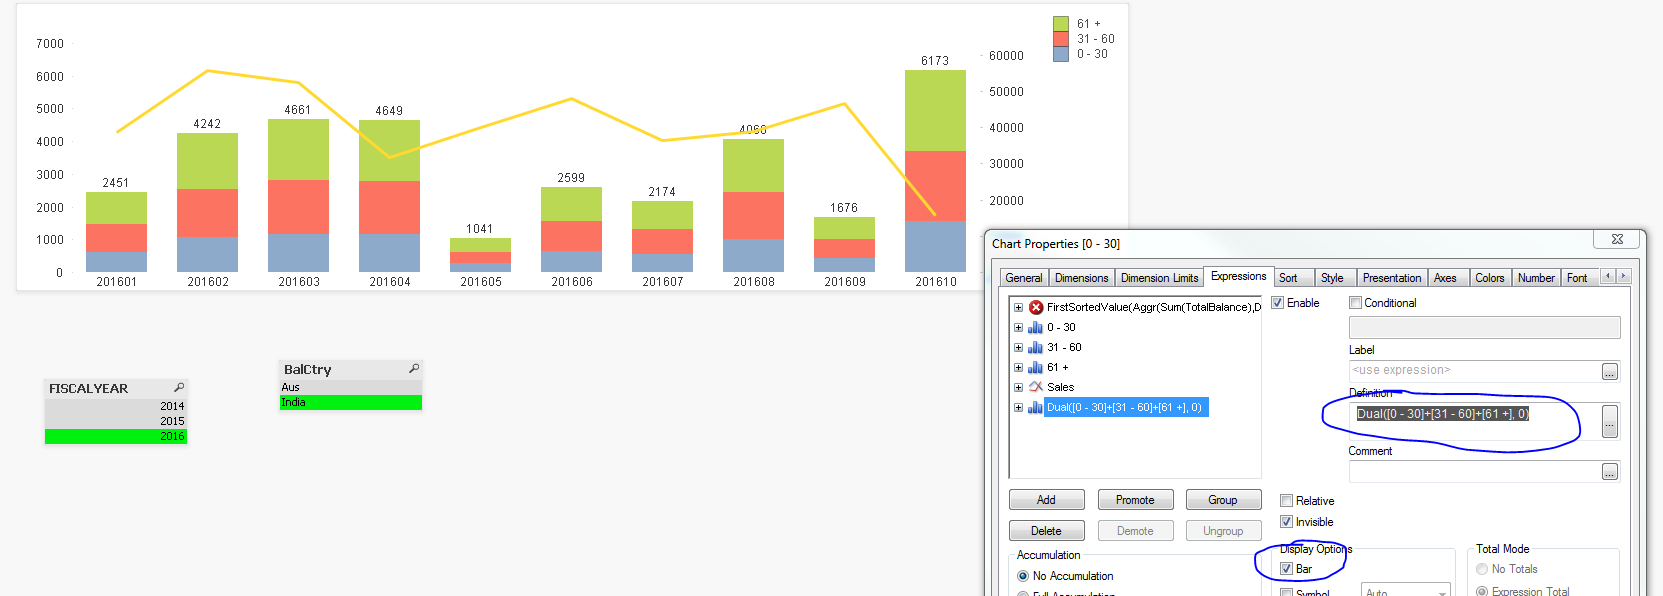
This seem to have worked
- Mark as New
- Bookmark
- Subscribe
- Mute
- Subscribe to RSS Feed
- Permalink
- Report Inappropriate Content
Something like this for your second issue?
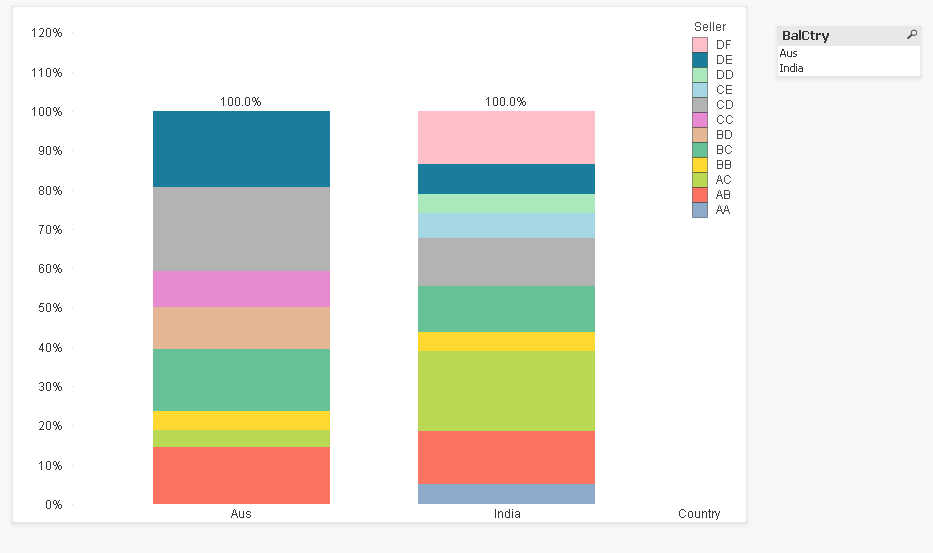
Expression:
FirstSortedValue(Aggr(Sum(TotalBalance),Date,BalCtry,Seller),-Aggr(Fisc_day_of_month,Date,BalCtry,Seller))/Sum(TOTAL <BalCtry> Aggr(FirstSortedValue(Aggr(Sum(TotalBalance),Date,BalCtry,Seller),-Aggr(Fisc_day_of_month,Date,BalCtry,Seller)), BalCtry, Seller))
- Mark as New
- Bookmark
- Subscribe
- Mute
- Subscribe to RSS Feed
- Permalink
- Report Inappropriate Content
Perfect , Thanks Sunny.
- « Previous Replies
-
- 1
- 2
- Next Replies »