Unlock a world of possibilities! Login now and discover the exclusive benefits awaiting you.
- Qlik Community
- :
- All Forums
- :
- QlikView App Dev
- :
- Re: Displaying values - Combo chart on DataPoints
- Subscribe to RSS Feed
- Mark Topic as New
- Mark Topic as Read
- Float this Topic for Current User
- Bookmark
- Subscribe
- Mute
- Printer Friendly Page
- Mark as New
- Bookmark
- Subscribe
- Mute
- Subscribe to RSS Feed
- Permalink
- Report Inappropriate Content
Displaying values - Combo chart on DataPoints
Hello,
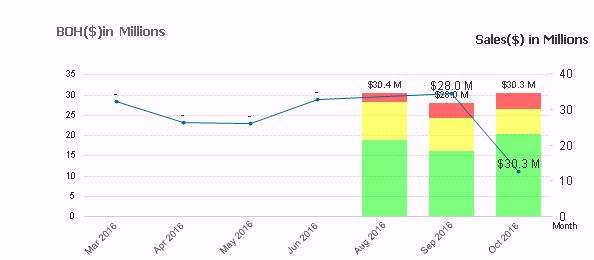
I want to display the Total values on top of each barwhich i have acheieved by using using an expression and making it invisible. However when i introduce a line graph, the values for the Bars are being shown for the line graph's data points which is wrong. Please help to resolve this issue.

- « Previous Replies
-
- 1
- 2
- Next Replies »
- Mark as New
- Bookmark
- Subscribe
- Mute
- Subscribe to RSS Feed
- Permalink
- Report Inappropriate Content
Awesome, I am glad it all worked out.
I would request you to close this thread by marking correct and helpful response as this will be helpful for other visitors in the future.
Qlik Community Tip: Marking Replies as Correct or Helpful
Best,
Sunny
- Mark as New
- Bookmark
- Subscribe
- Mute
- Subscribe to RSS Feed
- Permalink
- Report Inappropriate Content
This seems to work if i dont apply any Dimension limits, but when i restricted the Seller to show only the Top 5 , the Total percentage shrinks.
I would want the Percentage for Australia to be at Same, and the bar should show the Top 5 Sellers with percentage and the rest % should be under "Others". Why does not it work if i just apply the Dimensions limit?
Thanks.
- Mark as New
- Bookmark
- Subscribe
- Mute
- Subscribe to RSS Feed
- Permalink
- Report Inappropriate Content
Would you be able to put down the numbers you want to see for each of the two countries in a table form so that I can see what you actual want?
- Mark as New
- Bookmark
- Subscribe
- Mute
- Subscribe to RSS Feed
- Permalink
- Report Inappropriate Content
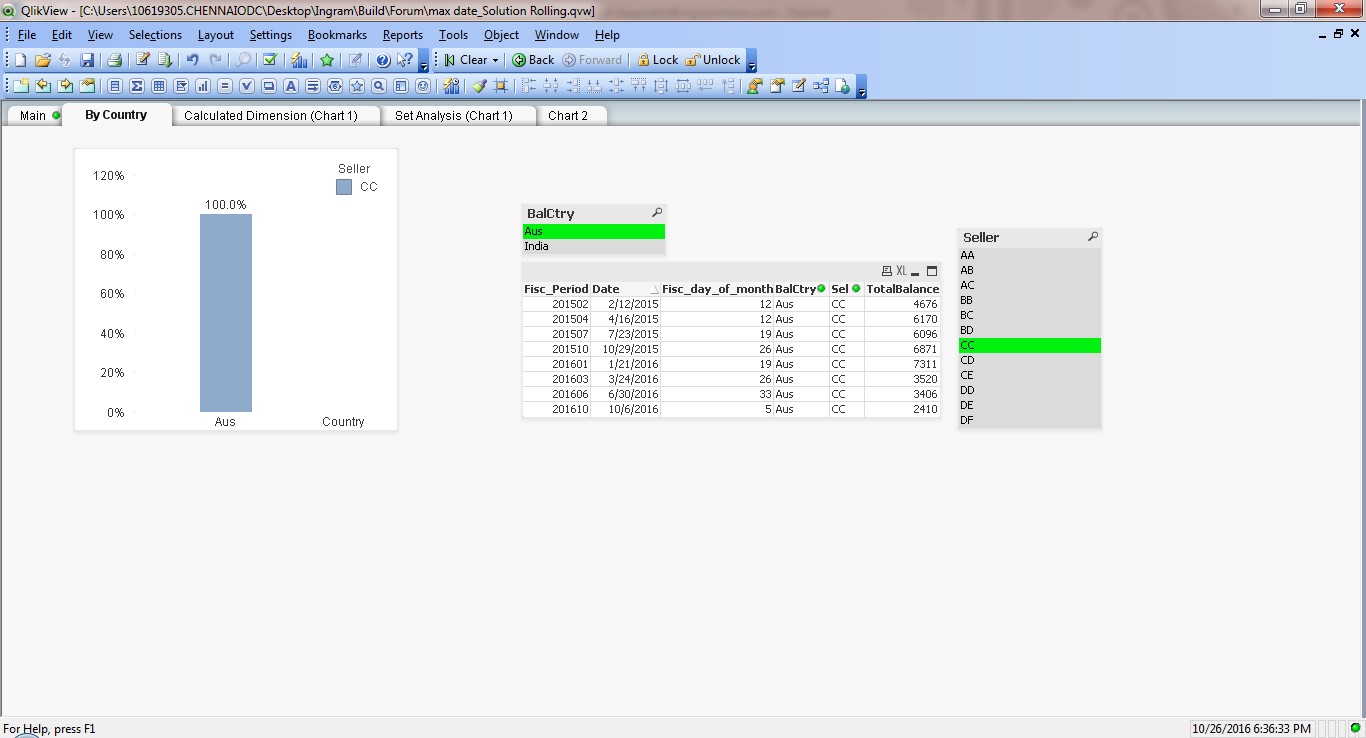
I just noticed that the FirstSortedValue function does not pick the expected value, i want the most recent value according to the dates to be picked for every seller. For example, for trhe Seller 525(CC), the most recent value is 2410 which is on 6th Oct 2016 and that should be picked.
| Date | 0-30 | 31-60 | 61+ | TotalBalance | BalCtry | SellerSK |
|---|---|---|---|---|---|---|
| 21-Jan-16 | 1827.75 | 2558.85 | 2924.4 | 7311 | Aus | 525 |
| 11-Feb-16 | 1557.5 | 2180.5 | 2492 | 6230 | India | 525 |
| 24-Mar-16 | 880 | 1232 | 1408 | 3520 | Aus | 525 |
| 14-Apr-16 | 851.5 | 1192.1 | 1362.4 | 3406 | India | 525 |
| 2-Jun-16 | 890 | 1246 | 1424 | 3560 | India | 525 |
| 30-Jun-16 | 851.5 | 1192.1 | 1362.4 | 3406 | Aus | 525 |
| 8-Sep-16 | 583.25 | 816.55 | 933.2 | 2333 | India | 525 |
| 6-Oct-16 | 602.5 | 843.5 | 964 | 2410 | Aus | 525 |
And this value should be used for calculating the percentage.
(Most recent Balance of Seller)/(Most Recent Balance of Entire Country).
Most recent balance of the Country will be the sum of balances across Sellers at their most recent dates, which will vary for each seller.
Please let me know if you need more information.
Thanks.
- Mark as New
- Bookmark
- Subscribe
- Mute
- Subscribe to RSS Feed
- Permalink
- Report Inappropriate Content
Attaching the qvw file here.
- Mark as New
- Bookmark
- Subscribe
- Mute
- Subscribe to RSS Feed
- Permalink
- Report Inappropriate Content
Solving the first part of the issue to pull the most recent value. Try this:
FirstSortedValue(Aggr(Sum(TotalBalance),Date,BalCtry,Seller),-Aggr(Date,Date,BalCtry,Seller))
Working on the % part now 
- Mark as New
- Bookmark
- Subscribe
- Mute
- Subscribe to RSS Feed
- Permalink
- Report Inappropriate Content
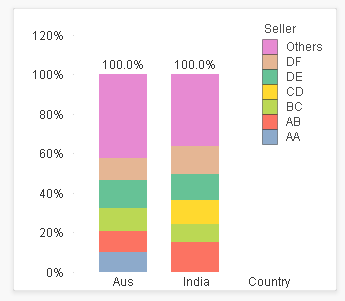
Is this the goal?
- Mark as New
- Bookmark
- Subscribe
- Mute
- Subscribe to RSS Feed
- Permalink
- Report Inappropriate Content
Thanks for the solution,Howeveri will not be able to group it on Dates only as I have to pick the recent value based on the Fiscal Months, that is the reason for using Fiscal_day_of_month in the Aggr.
FirstSortedValue(Aggr(Sum(TotalBalance),Date,BalCtry,Seller),-Aggr(Fisc_day_of_month,Date,BalCtry,Seller))/Sum(TOTAL <BalCtry> Aggr(FirstSortedValue(Aggr(Sum(TotalBalance),Date,BalCtry,Seller),-Aggr(Fisc_day_of_month,Date,BalCtry,Seller)), BalCtry, Seller))
- Mark as New
- Bookmark
- Subscribe
- Mute
- Subscribe to RSS Feed
- Permalink
- Report Inappropriate Content
The issue is that Fisc_day_of_month is smallest here:
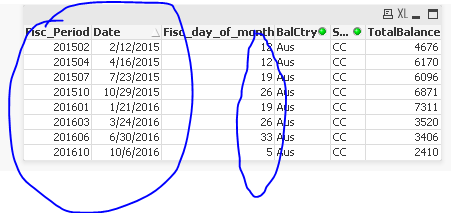
So FirstSortedValue() function will pick the second last row based on Fisc_day_of_month. You need to either use Fisc_Period or Date to meet your requirement. Using Fisc_day_of_month, you will never meet you requirement.
Best,
Sunny
- Mark as New
- Bookmark
- Subscribe
- Mute
- Subscribe to RSS Feed
- Permalink
- Report Inappropriate Content
Is it possible to display the percentages on every Segment?
And can we fix the "Others" with a persistent color part to be at the top at all times?
And this chart should not react to any of the Selections in the Seller dimension.
Thanks.
- « Previous Replies
-
- 1
- 2
- Next Replies »