Unlock a world of possibilities! Login now and discover the exclusive benefits awaiting you.
- Qlik Community
- :
- Forums
- :
- Analytics
- :
- App Development
- :
- Re: Creating a list from Variables in Set Analysis
- Subscribe to RSS Feed
- Mark Topic as New
- Mark Topic as Read
- Float this Topic for Current User
- Bookmark
- Subscribe
- Mute
- Printer Friendly Page
- Mark as New
- Bookmark
- Subscribe
- Mute
- Subscribe to RSS Feed
- Permalink
- Report Inappropriate Content
Creating a list from Variables in Set Analysis
I am trying to use multiple variables to limit a single dimension in Set Analysis for a master measure.
I am using the below script in a Chart with "Business Unit" & "Quarter-Year" as a dimension, and it's not working.
Quarter-Year = {$(Variable_1),$(Variable_2),$(Variable_3)}
Since "Quarter-Year" is a text field, I can't use a range such as {">=$(=$(Variable_1))<=$(=$(Variable_3))"}, either.
Would this work better as an OR, or is there another way to write this?
Should I create new fields in the Data Model to replace the Variables?
I initially tried using the following, but it breaks my Color By Expression for the Business Units:
[Summary Date]={'>=$(=date(QuarterStart(AddMonths(Max([Summary Date]),-11))))<=$(=Max([Summary Date]))'}
Here is my Color By Expression script:
RGB(Subfield([Summary_BUColor],',',1), Subfield([Summary_BUColor],',',2), Subfield([Summary_BUColor],',',3))
Suggestions to make any of the above work would be appreciated.
Thanks.
-Mike
Accepted Solutions
- Mark as New
- Bookmark
- Subscribe
- Mute
- Subscribe to RSS Feed
- Permalink
- Report Inappropriate Content
Try this out:
RGB(Subfield(Only({1} [Summary_BUColor]),',',1), Subfield(Only({1} [Summary_BUColor]),',',2), Subfield(Only({1} [Summary_BUColor]),',',3))
- Mark as New
- Bookmark
- Subscribe
- Mute
- Subscribe to RSS Feed
- Permalink
- Report Inappropriate Content
1) I am not completely sure I follow, are you using this
{$(Variable_1),$(Variable_2),$(Variable_3)}
as your second dimension Quarter-Year? or is this a set analysis used in your expression?
2) What is the relation of color and this expression? I am not sure I understand that, can you may be share a sample and demonstrate the issue to us?
- Mark as New
- Bookmark
- Subscribe
- Mute
- Subscribe to RSS Feed
- Permalink
- Report Inappropriate Content
Sunny,
I've attached my report.
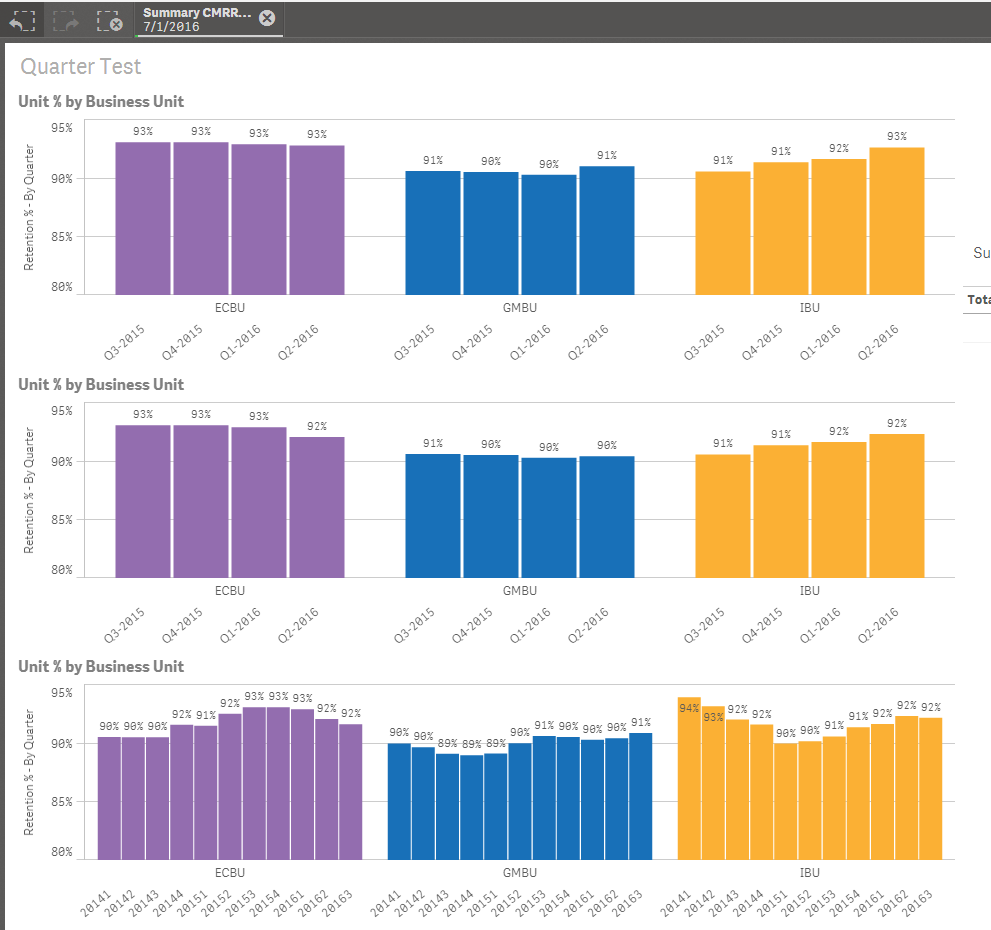
My main concern is getting the chart to maintain the colors by expression for the [Summary Business Unit] in the charts.
Whenever I make a selection, it loses the colors, with the exception of when selecting the max month within a quarter.
Each chart in the attached report has a different way of keeping the range of 4 quarters, with the exception of the third one, which uses the value of the fields based on the month selected ([1 Qtr Back],[2 Qtrs Back],[3 Qtrs Back]).
The table represents the quarters that should be used based on the month selected.
Thank you for taking some time to look at this.
-Mike
- Mark as New
- Bookmark
- Subscribe
- Mute
- Subscribe to RSS Feed
- Permalink
- Report Inappropriate Content
Try this out:
RGB(Subfield(Only({1} [Summary_BUColor]),',',1), Subfield(Only({1} [Summary_BUColor]),',',2), Subfield(Only({1} [Summary_BUColor]),',',3))
- Mark as New
- Bookmark
- Subscribe
- Mute
- Subscribe to RSS Feed
- Permalink
- Report Inappropriate Content
Ugh...something so simple.
Thank you so much Sunny!! This is perfect!
-Mike