Unlock a world of possibilities! Login now and discover the exclusive benefits awaiting you.
- Qlik Community
- :
- All Forums
- :
- QlikView App Dev
- :
- Is there a way to create a dynamic chart using a t...
- Subscribe to RSS Feed
- Mark Topic as New
- Mark Topic as Read
- Float this Topic for Current User
- Bookmark
- Subscribe
- Mute
- Printer Friendly Page
- Mark as New
- Bookmark
- Subscribe
- Mute
- Subscribe to RSS Feed
- Permalink
- Report Inappropriate Content
Is there a way to create a dynamic chart using a table of fields?
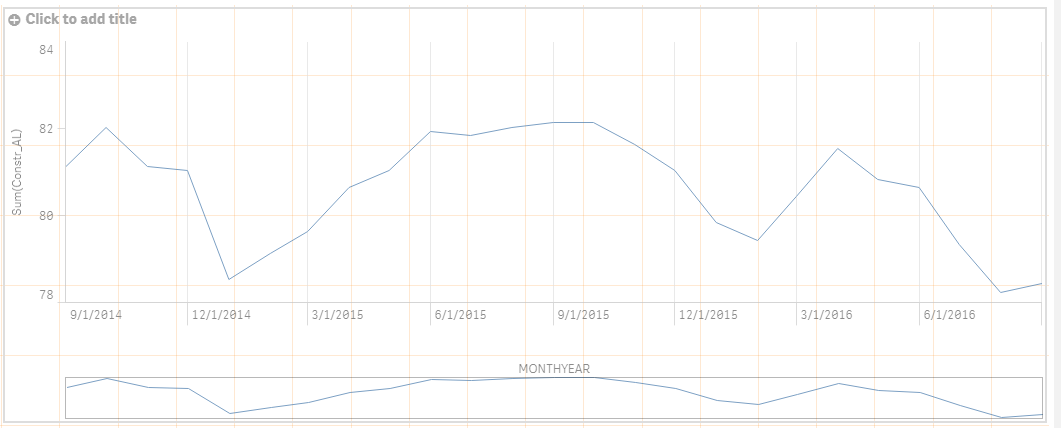
I would like to add a filter to a graph chart so I could easily visualize data by clicking on each of the series. Is this possible in Qlik Sense?
Currently the chart contains data for a single sector within a single state. If I wanted to load more sectors, and add a filter at the top I would be able to dynamically change the charted values in the chart.
I hope someone could help me.
Thank you!
- Mark as New
- Bookmark
- Subscribe
- Mute
- Subscribe to RSS Feed
- Permalink
- Report Inappropriate Content
Add a filter pane object to the sheet and then add the dimensions you want to use for filtering to the filter pane.
You can also use the global search to search for and select values in dimensions. See this document for more information: Qlik Sense - Global Smart Search (video)
BTW. You posted in the Qlikview section, but your question is about Qlik Sense. There's a section of this site dedicated to Qlik Sense. The New to Qlik Sense space is probably the best place for this discussion.
talk is cheap, supply exceeds demand