Unlock a world of possibilities! Login now and discover the exclusive benefits awaiting you.
- Qlik Community
- :
- All Forums
- :
- QlikView App Dev
- :
- Gantt Chart - Separate Transactions
- Subscribe to RSS Feed
- Mark Topic as New
- Mark Topic as Read
- Float this Topic for Current User
- Bookmark
- Subscribe
- Mute
- Printer Friendly Page
- Mark as New
- Bookmark
- Subscribe
- Mute
- Subscribe to RSS Feed
- Permalink
- Report Inappropriate Content
Gantt Chart - Separate Transactions
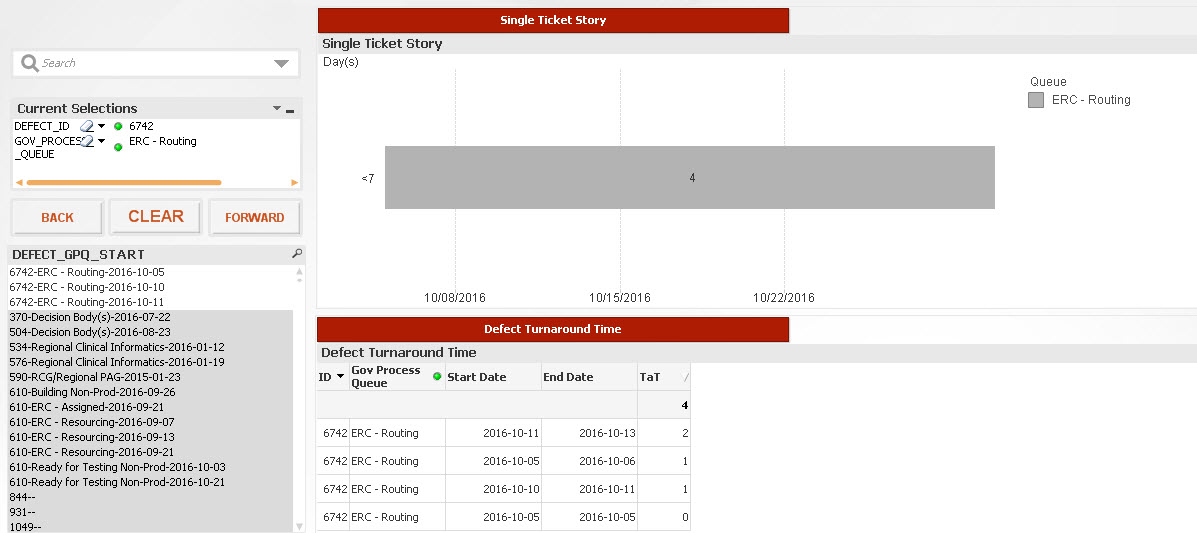
I am using a Gantt Chart to show a ticket process path. If you select DEFECT_ID 6742, you can see in the Gantt that ERC - Routing shows 4 days but if you look at the chart below, you will see that that step has 4 instances with different durations that total 4 days.
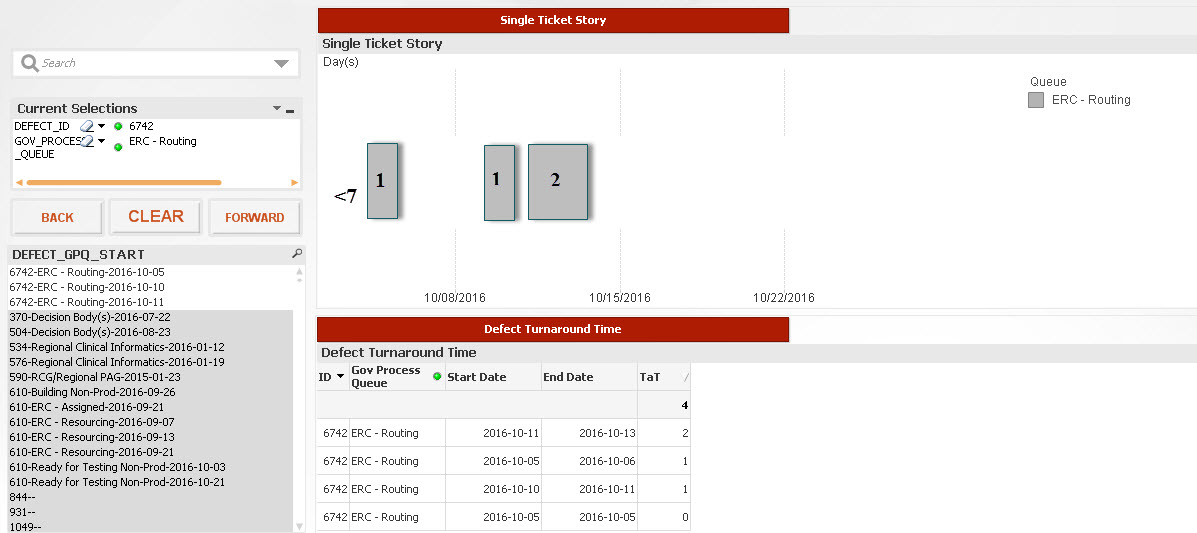
I created a key called DEFECT_GPQ_START in hopes that I could use this to separate the boxes in the Gantt so that instead of one box per Queue step, it shows one box per transaction... see current vs desired view. Anyone have an idea on how to do this?
Current:
Desired:
- Mark as New
- Bookmark
- Subscribe
- Mute
- Subscribe to RSS Feed
- Permalink
- Report Inappropriate Content
have a look at attached sample
hope this helps
- Mark as New
- Bookmark
- Subscribe
- Mute
- Subscribe to RSS Feed
- Permalink
- Report Inappropriate Content
Thanks, Frank, but I still need the buckets with the thresholds of <7, 7-14, >14 etc
- Mark as New
- Bookmark
- Subscribe
- Mute
- Subscribe to RSS Feed
- Permalink
- Report Inappropriate Content
Hi Cassandra,
have a look at attached sample!
Hope this helps
- Mark as New
- Bookmark
- Subscribe
- Mute
- Subscribe to RSS Feed
- Permalink
- Report Inappropriate Content
I appreciate the thought but have you seen my attached example? I need to keep the chart in that format with the Gantt chart look and the class (buckets by 7 days) but to separate the individual GOV_PROCESS_QUEUE_TAT as in my Desired photo.