Unlock a world of possibilities! Login now and discover the exclusive benefits awaiting you.
- Qlik Community
- :
- All Forums
- :
- QlikView App Dev
- :
- Re: Weekly and YTD Value in combo chart
- Subscribe to RSS Feed
- Mark Topic as New
- Mark Topic as Read
- Float this Topic for Current User
- Bookmark
- Subscribe
- Mute
- Printer Friendly Page
- Mark as New
- Bookmark
- Subscribe
- Mute
- Subscribe to RSS Feed
- Permalink
- Report Inappropriate Content
Weekly and YTD Value in combo chart
Hi Experts,
I have a combo chart where the dimensions are week and then the first measure that i am using is the sum(count) at a week level
but i am not getting the YTD value
e.g.
for weeek 1 value will be 10 and YTD will be10
for week 2 value will be 20 and YTD will be 30
THis should be grouped at week and year level.
I have attached the sample file.
- « Previous Replies
- Next Replies »
- Mark as New
- Bookmark
- Subscribe
- Mute
- Subscribe to RSS Feed
- Permalink
- Report Inappropriate Content
I Had changed the query as per the same dimensions that i have in my report but i am getting wrong values for every week.
- Mark as New
- Bookmark
- Subscribe
- Mute
- Subscribe to RSS Feed
- Permalink
- Report Inappropriate Content
I tried the same expression in the sample qvf you provided, it seems to work for me. Could you show/explain the differences you are getting?
- Mark as New
- Bookmark
- Subscribe
- Mute
- Subscribe to RSS Feed
- Permalink
- Report Inappropriate Content
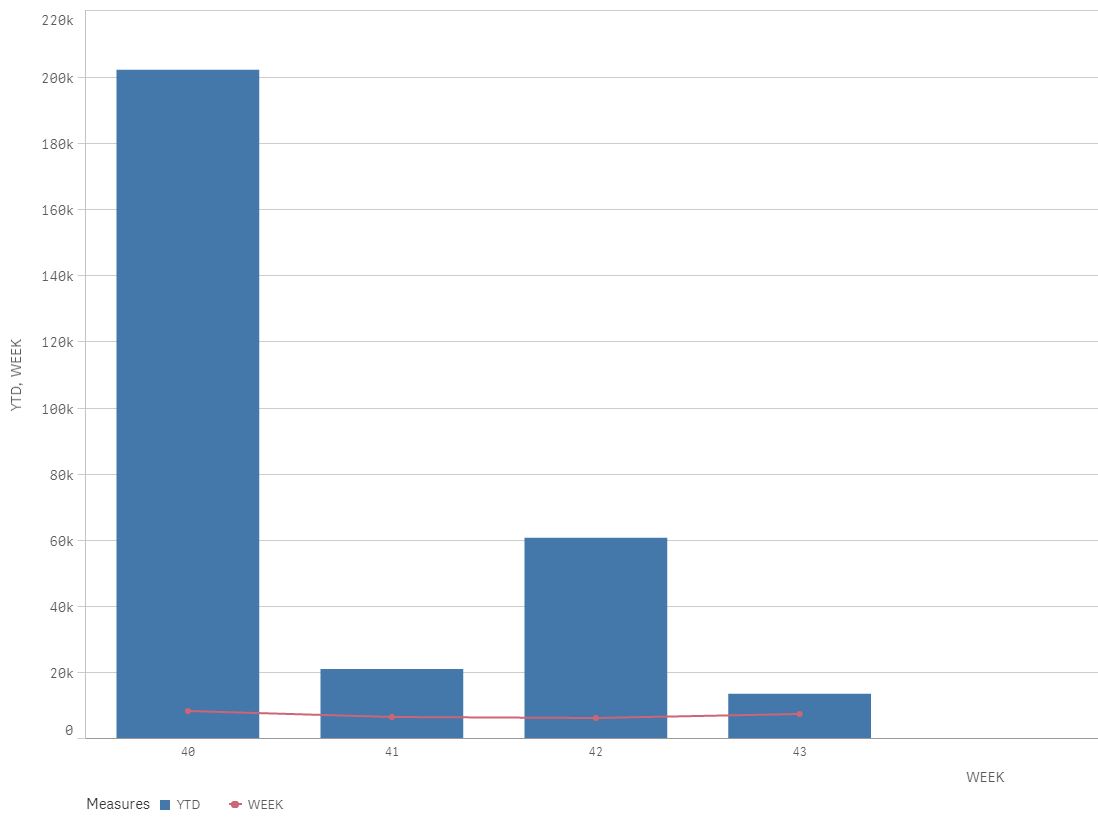
As on every week YTD should increase but here its not stable.
- Mark as New
- Bookmark
- Subscribe
- Mute
- Subscribe to RSS Feed
- Permalink
- Report Inappropriate Content
As on every week YTD should increase but here its not stable.

- Mark as New
- Bookmark
- Subscribe
- Mute
- Subscribe to RSS Feed
- Permalink
- Report Inappropriate Content
The sample you provided above is a different one that has WeekYear (2016/01...) as dimension. Try to share the qvf you are working with (with sample data).
- Mark as New
- Bookmark
- Subscribe
- Mute
- Subscribe to RSS Feed
- Permalink
- Report Inappropriate Content
Its almost the same data.
dimension is only week and measure will have value for the week and Calculated YTD
- Mark as New
- Bookmark
- Subscribe
- Mute
- Subscribe to RSS Feed
- Permalink
- Report Inappropriate Content
If your dimension is WEEk and you are selecting in WeekYear fied, you need to bypass the WeekYear field selection as well. Try the expression:
Sum(Aggr(rangesum(Above(Total sum({<WeekYear, WEEK>} COUNT),0,RowNo(Total))),WEEK))
- « Previous Replies
- Next Replies »