Unlock a world of possibilities! Login now and discover the exclusive benefits awaiting you.
- Qlik Community
- :
- Forums
- :
- Analytics
- :
- App Development
- :
- Re: how to order alternative dimensions?
- Subscribe to RSS Feed
- Mark Topic as New
- Mark Topic as Read
- Float this Topic for Current User
- Bookmark
- Subscribe
- Mute
- Printer Friendly Page
- Mark as New
- Bookmark
- Subscribe
- Mute
- Subscribe to RSS Feed
- Permalink
- Report Inappropriate Content
how to order alternative dimensions?
Hi,
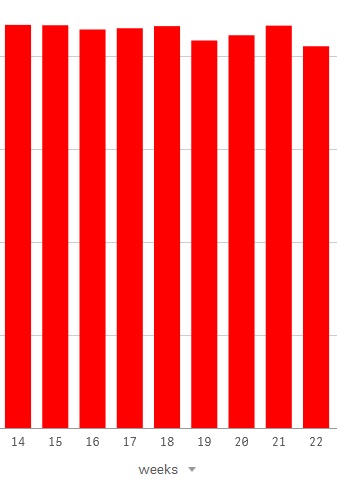
I do have a simple bar chart that is aggregating data by week and is also ordering by week.
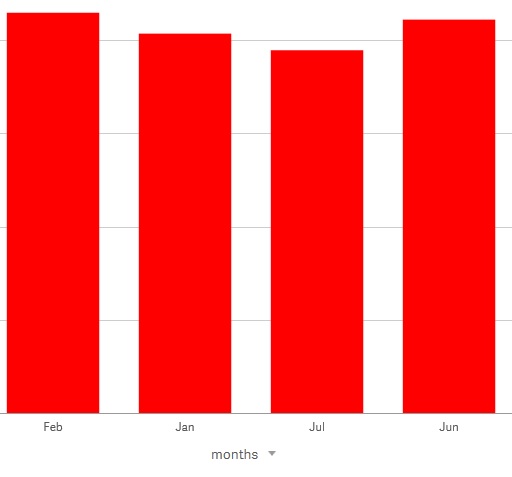
If I switch to the alternative dimension month, it is showing data in incorrect order.
I have not found a way to define how data should be ordered for alternative dimensions. Can you help?
Accepted Solutions
- Mark as New
- Bookmark
- Subscribe
- Mute
- Subscribe to RSS Feed
- Permalink
- Report Inappropriate Content
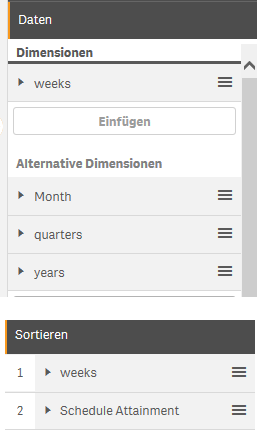
Select Dimensions one by one and then choose sorting for them.
- Mark as New
- Bookmark
- Subscribe
- Mute
- Subscribe to RSS Feed
- Permalink
- Report Inappropriate Content
Hi Malik,
any chance that you could upload a sample .qvf?
Andy
- Mark as New
- Bookmark
- Subscribe
- Mute
- Subscribe to RSS Feed
- Permalink
- Report Inappropriate Content
In Sorting section, there will be a dropdown of alternative dimension . . Select each dimension and sort in appropriate order
- Mark as New
- Bookmark
- Subscribe
- Mute
- Subscribe to RSS Feed
- Permalink
- Report Inappropriate Content
Unfortunately, I'm not allowed to share the data but I will try to create a demo app of the issue with dummy data
- Mark as New
- Bookmark
- Subscribe
- Mute
- Subscribe to RSS Feed
- Permalink
- Report Inappropriate Content
That's not correct. I know it is possible if you show multiple dimensions at once but in case of alternative dimensions it's not showing additional dimension. I only see the default dimension and the default measure:
- Mark as New
- Bookmark
- Subscribe
- Mute
- Subscribe to RSS Feed
- Permalink
- Report Inappropriate Content
Select Dimensions one by one and then choose sorting for them.
- Mark as New
- Bookmark
- Subscribe
- Mute
- Subscribe to RSS Feed
- Permalink
- Report Inappropriate Content
Not a very intuitive solution from Qlik but it indeed worked. Thanks a lot! 
- Mark as New
- Bookmark
- Subscribe
- Mute
- Subscribe to RSS Feed
- Permalink
- Report Inappropriate Content
it's really bad indeed, specially when you have 30 alternative measures