Unlock a world of possibilities! Login now and discover the exclusive benefits awaiting you.
- Qlik Community
- :
- All Forums
- :
- QlikView App Dev
- :
- Combine 2 measures in one bar
- Subscribe to RSS Feed
- Mark Topic as New
- Mark Topic as Read
- Float this Topic for Current User
- Bookmark
- Subscribe
- Mute
- Printer Friendly Page
- Mark as New
- Bookmark
- Subscribe
- Mute
- Subscribe to RSS Feed
- Permalink
- Report Inappropriate Content
Combine 2 measures in one bar
Hi,
I am trying to create a bar chart with two measures Performance & opportunity and want the graph to have only one bar for Opportunity such that if Performance is less than Opportunity (Say 50 %) then 50% of Oppotunity line should show as green and remaining 50 % of the Opportunity bar should show as red.
Also i have another measure Target. I want to show a vertical line in each bar as a mark for target.
Please advice how to acheive this.
Thanks
Arun
Accepted Solutions
- Mark as New
- Bookmark
- Subscribe
- Mute
- Subscribe to RSS Feed
- Permalink
- Report Inappropriate Content
Dear Martin & Niranjan,
Thanks a ton for quick response.
Martin i agree it was a stacking but break into pieces.
Thanks Niranjan for showing the right direction, i was trying to see if there is a built in feature within tool to combine two measure and not by create expressions.
But this is what i did -
Performance = Sum(Performance)
Opportunity = Sum(Opportunity) - Sum(Performance)
Target = Sum(Target)
And used combo chart.
- Mark as New
- Bookmark
- Subscribe
- Mute
- Subscribe to RSS Feed
- Permalink
- Report Inappropriate Content
Hi,
Please find the attachment that may help u...
- Mark as New
- Bookmark
- Subscribe
- Mute
- Subscribe to RSS Feed
- Permalink
- Report Inappropriate Content
Thanks a ton Niranjan.
I am unable to open your file. Can you please send me the logic and breif description of how to.
my email - gurumurthi.arun@securityhealth.org
Thanks
Arun
- Mark as New
- Bookmark
- Subscribe
- Mute
- Subscribe to RSS Feed
- Permalink
- Report Inappropriate Content
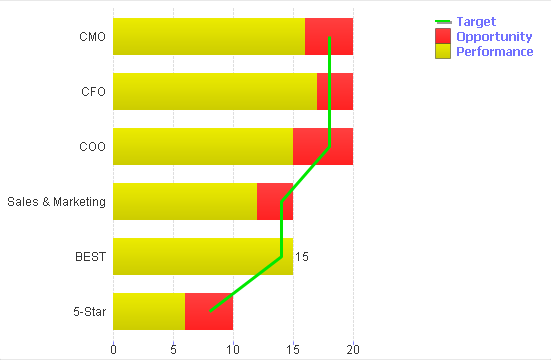
1. Select "combo chart" as chart type.
2. Set the property "Style --> Subtype --> Stacked"

3. Set 2 expressions as bar:
- 1 for the 1st stack
- 1 for the 2nd stack
4. Set a 3rd expression as line or symbol
5. Change the colors in the "Colors" tab.
You will have a chart that look like this :
- Mark as New
- Bookmark
- Subscribe
- Mute
- Subscribe to RSS Feed
- Permalink
- Report Inappropriate Content
Thanks a ton Martin.
But i do not want stacking rather i want Part of Opportunity to reflect in different collors. If Performance is 30% then 30% of opportunity line should show as green and remaining as red.
Please advice.
Thanks
Arun
- Mark as New
- Bookmark
- Subscribe
- Mute
- Subscribe to RSS Feed
- Permalink
- Report Inappropriate Content
Hi,
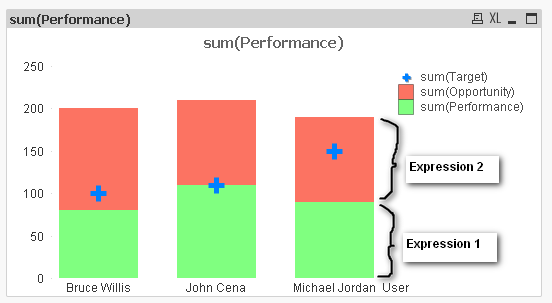
I used stocked bar chart to meet your requirement.
I used to expressions.
One expression that to show opportunity in green color based performance.
And the other expression to show remaining opportunity in red color.
I hope it may help u…
I am attaching qvw file and screenshots…
And revert back…..
- Mark as New
- Bookmark
- Subscribe
- Mute
- Subscribe to RSS Feed
- Permalink
- Report Inappropriate Content
But i do not want stacking
What you describe IS stacking...
i want Part of Opportunity to reflect in different collors. If Performance is 30% then 30% of opportunity line should show as green and remaining as red.
So, your first expression is "x% of opportunity" (displayed in green) and your second is "opportunity - x% of opportunity" (displayed in red), where "x" is your performance !
- Mark as New
- Bookmark
- Subscribe
- Mute
- Subscribe to RSS Feed
- Permalink
- Report Inappropriate Content
Dear Martin & Niranjan,
Thanks a ton for quick response.
Martin i agree it was a stacking but break into pieces.
Thanks Niranjan for showing the right direction, i was trying to see if there is a built in feature within tool to combine two measure and not by create expressions.
But this is what i did -
Performance = Sum(Performance)
Opportunity = Sum(Opportunity) - Sum(Performance)
Target = Sum(Target)
And used combo chart.