Unlock a world of possibilities! Login now and discover the exclusive benefits awaiting you.
- Qlik Community
- :
- Forums
- :
- Analytics
- :
- New to Qlik Analytics
- :
- Re: Year over Year Comparison with Stacked Bar Cha...
- Subscribe to RSS Feed
- Mark Topic as New
- Mark Topic as Read
- Float this Topic for Current User
- Bookmark
- Subscribe
- Mute
- Printer Friendly Page
- Mark as New
- Bookmark
- Subscribe
- Mute
- Subscribe to RSS Feed
- Permalink
- Report Inappropriate Content
Year over Year Comparison with Stacked Bar Chart
I have a table of data with Loaded Miles, Empty Miles, Delivery Date, Delivery Year, Delivery Quarter, and Delivery Month. The Loaded and Empty Miles make up the stacked bars. I have a Drilldown created that goes Year > Quarter > Month. Now, I need to add a year over year comparison. How do I add the YoY comparison?
- Mark as New
- Bookmark
- Subscribe
- Mute
- Subscribe to RSS Feed
- Permalink
- Report Inappropriate Content
- Mark as New
- Bookmark
- Subscribe
- Mute
- Subscribe to RSS Feed
- Permalink
- Report Inappropriate Content
Create another expression with Set Analysis for last year
- Mark as New
- Bookmark
- Subscribe
- Mute
- Subscribe to RSS Feed
- Permalink
- Report Inappropriate Content
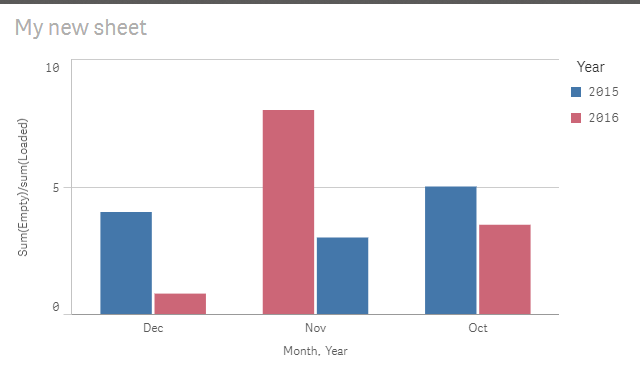
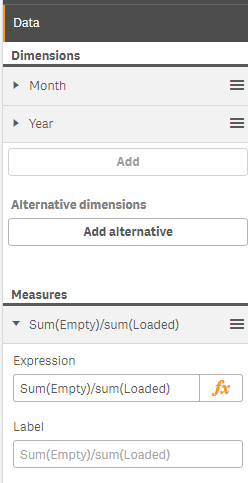
The above discussion is really good for understanding how to setup year-over-year measures and data models. It sounds like you want a stacked bar for current year grouped next to a stacked bar for prior year. I don't think this is possible in QlikSense. You can't have grouped stacked bars on the same plot only grouped single bars. If you can come up with a single measure like the ratio of empty to loaded, then you can group by year to look at year-over-year. Something like the below: