Unlock a world of possibilities! Login now and discover the exclusive benefits awaiting you.
- Qlik Community
- :
- Forums
- :
- Analytics
- :
- New to Qlik Analytics
- :
- How to show border line in Gauge
- Subscribe to RSS Feed
- Mark Topic as New
- Mark Topic as Read
- Float this Topic for Current User
- Bookmark
- Subscribe
- Mute
- Printer Friendly Page
- Mark as New
- Bookmark
- Subscribe
- Mute
- Subscribe to RSS Feed
- Permalink
- Report Inappropriate Content
How to show border line in Gauge
Hi All,
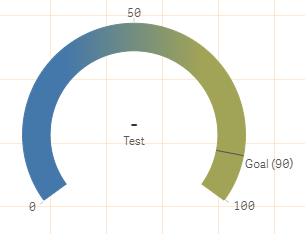
I have a gauge chart in Qlik Sense. Need to show Red till 90 and 90-100 in Green. This is working fine. But user wants to see the Border line value as 90 in junction of Red and Green.
Currently we have:

I want to show 90% in the junction of Red and Green.
Can anyone please suggest me on this.
Thanks,
Sarif
Accepted Solutions
- Mark as New
- Bookmark
- Subscribe
- Mute
- Subscribe to RSS Feed
- Permalink
- Report Inappropriate Content
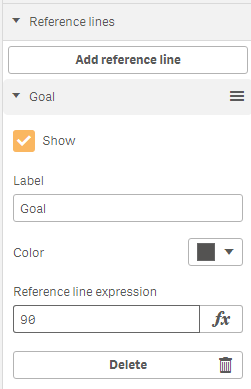
I think you can likely do what you want with a reference line. You can find this under "Add-ons" --> Reference Line. See below example:
- Mark as New
- Bookmark
- Subscribe
- Mute
- Subscribe to RSS Feed
- Permalink
- Report Inappropriate Content
Hi,
Check for this extension.
GitHub - CodingBSilva/CanvGauge: Pure HTML5/JavaScript gauge implementation now for Qlik Sense.
Regards,
Kaushik Solanki
- Mark as New
- Bookmark
- Subscribe
- Mute
- Subscribe to RSS Feed
- Permalink
- Report Inappropriate Content
I think you can likely do what you want with a reference line. You can find this under "Add-ons" --> Reference Line. See below example:
- Mark as New
- Bookmark
- Subscribe
- Mute
- Subscribe to RSS Feed
- Permalink
- Report Inappropriate Content
Thanks Sarah...it is working...