Unlock a world of possibilities! Login now and discover the exclusive benefits awaiting you.
- Qlik Community
- :
- All Forums
- :
- QlikView App Dev
- :
- How do I plot chart data to a secondary X axisin m...
- Subscribe to RSS Feed
- Mark Topic as New
- Mark Topic as Read
- Float this Topic for Current User
- Bookmark
- Subscribe
- Mute
- Printer Friendly Page
- Mark as New
- Bookmark
- Subscribe
- Mute
- Subscribe to RSS Feed
- Permalink
- Report Inappropriate Content
How do I plot chart data to a secondary X axisin my line chart?
Hello - I am brand new to Qlikview - please can anyone help me to plot a series of my data on a secondary axis in chart's Y axis? The chart has 1 dimension (time) on the X axis and 3 measures (chart lines) for the Y axis ... 2 are "money" and similar in scale and the third is a (calculated) percentage which differs greatly in range from the other two. I would like to put this third percentage measure onto a second y axis. Thanks in advance. Jules
- Tags:
- new_to_qlikview
Accepted Solutions
- Mark as New
- Bookmark
- Subscribe
- Mute
- Subscribe to RSS Feed
- Permalink
- Report Inappropriate Content
If I understand you correctly I think you can use Combo Charts for this.
On the Axes tab you can position your expressions left or right.
Hope this is what you are looking for.
- Mark as New
- Bookmark
- Subscribe
- Mute
- Subscribe to RSS Feed
- Permalink
- Report Inappropriate Content
If I understand you correctly I think you can use Combo Charts for this.
On the Axes tab you can position your expressions left or right.
Hope this is what you are looking for.
- Mark as New
- Bookmark
- Subscribe
- Mute
- Subscribe to RSS Feed
- Permalink
- Report Inappropriate Content
Hi,
You need to go to the chart properties -> Axes tab -> Choose the Expression you want to change the Y axis and change the position
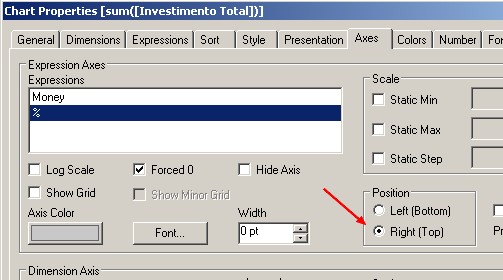
Hope it helps,
Erich
- Mark as New
- Bookmark
- Subscribe
- Mute
- Subscribe to RSS Feed
- Permalink
- Report Inappropriate Content
Many thanks for your help Dennis & Erich - it works. Jules