Unlock a world of possibilities! Login now and discover the exclusive benefits awaiting you.
- Qlik Community
- :
- Forums
- :
- Analytics
- :
- New to Qlik Analytics
- :
- Re: How to add a second total row in straight tabl...
- Subscribe to RSS Feed
- Mark Topic as New
- Mark Topic as Read
- Float this Topic for Current User
- Bookmark
- Subscribe
- Mute
- Printer Friendly Page
- Mark as New
- Bookmark
- Subscribe
- Mute
- Subscribe to RSS Feed
- Permalink
- Report Inappropriate Content
How to add a second total row in straight table?
Hi,
I have a simple question and I can't seem to find the solution. I have a straight table with a single dimension and a few expressions.
I also added a column with the sum of the values of the three columns, and a total row at the bottom. The table looks something like this.
Dim E1 E2 E3 Total
A 10 15 5 30
B 8 3 4 15
C 7 4 14 25
Total 25 22 23 70
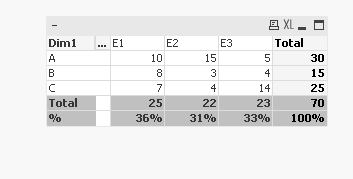
I need to add another row underneath the total row with the relative value of the total of each expression. Something like this.
Dim E1 E2 E3 Total
A 10 15 5 30
B 8 3 4 15
C 7 4 14 25
Total 25 22 23 70
% 36% 31% 33% 100%
Is this possible? Is there a simple way to do it?
Thank you very much
- « Previous Replies
-
- 1
- 2
- Next Replies »
Accepted Solutions
- Mark as New
- Bookmark
- Subscribe
- Mute
- Subscribe to RSS Feed
- Permalink
- Report Inappropriate Content
- Mark as New
- Bookmark
- Subscribe
- Mute
- Subscribe to RSS Feed
- Permalink
- Report Inappropriate Content
Look at the attached
- Mark as New
- Bookmark
- Subscribe
- Mute
- Subscribe to RSS Feed
- Permalink
- Report Inappropriate Content
Not possible in sense.. There will be always 1 total row
- Mark as New
- Bookmark
- Subscribe
- Mute
- Subscribe to RSS Feed
- Permalink
- Report Inappropriate Content
Sorry, I meant qlikview.
- Mark as New
- Bookmark
- Subscribe
- Mute
- Subscribe to RSS Feed
- Permalink
- Report Inappropriate Content
hi
You can try like this,
In straight table we can see the totals for each and every expression
and
by relative option we can see the percentages for that values.....
but in straight table we can only see the totals in one row only.
- Mark as New
- Bookmark
- Subscribe
- Mute
- Subscribe to RSS Feed
- Permalink
- Report Inappropriate Content
You can write the expresions as
sum(E1)
sum(E2)
Sum(E3)
sum(E1+E2+E3)
sum(E1+E2+E3)/sum(All E1+E2+E3)
- Mark as New
- Bookmark
- Subscribe
- Mute
- Subscribe to RSS Feed
- Permalink
- Report Inappropriate Content
Did the sample I provided not what you want?
- Mark as New
- Bookmark
- Subscribe
- Mute
- Subscribe to RSS Feed
- Permalink
- Report Inappropriate Content
Hi Sunny,
can you do IslandDim filed in front itself?
the above result can achieve in front end?
- Mark as New
- Bookmark
- Subscribe
- Mute
- Subscribe to RSS Feed
- Permalink
- Report Inappropriate Content
Hi,
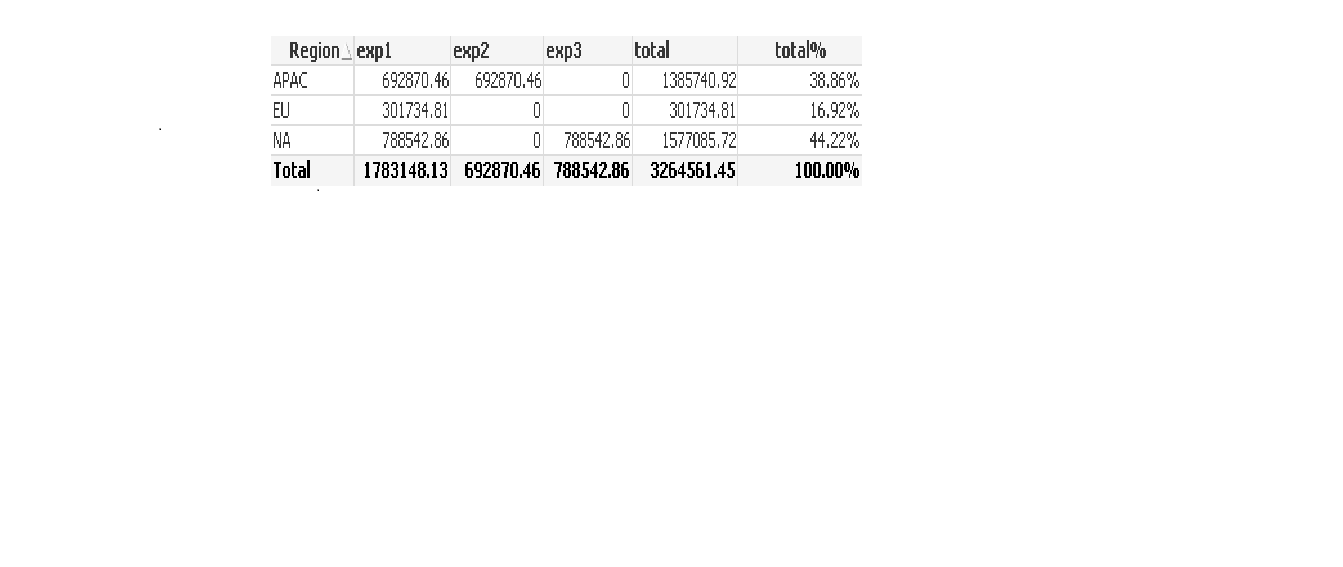
This is solution/workaround which can be used in both: QlikView & Sense. Lets just assume we want to create table where we want to look at sales by Customer and have Total $ and Total %
First step is to create additional grouped dimension by applying script from below. It creates total for all available values under dimension which we want to use as grouping. Next step is simply to use grouped dimension field as your dimension WITHOUT Totals as totals will be created automaticly.
Obviously then you have to just take care of proper sorting which is fairly easy.
Attached is sample app with this result:
| Customers: | |
| LOAD | |
| FIELDVALUE('%CustomerId',ITERNO()) AS %CustomerId, |
FIELDVALUE('%CustomerId',ITERNO()) AS Customer2
| AUTOGENERATE | |
| (1) | |
| WHILE | |
| NOT ISNULL(FIELDVALUE('%CustomerId',ITERNO())) |
;
Concatenate (Customers)
Load DISTINCT
| %CustomerId, | ||
| 'Total' | as Customer2 | |
| Resident | ||
| Customers | ||
| ; |
Concatenate (Customers)
Load DISTINCT
| %CustomerId, | ||
| 'Total %' | as Customer2 | |
| Resident | ||
| Customers | ||
| ; |
hope this helps
regards
Lech
- Mark as New
- Bookmark
- Subscribe
- Mute
- Subscribe to RSS Feed
- Permalink
- Report Inappropriate Content
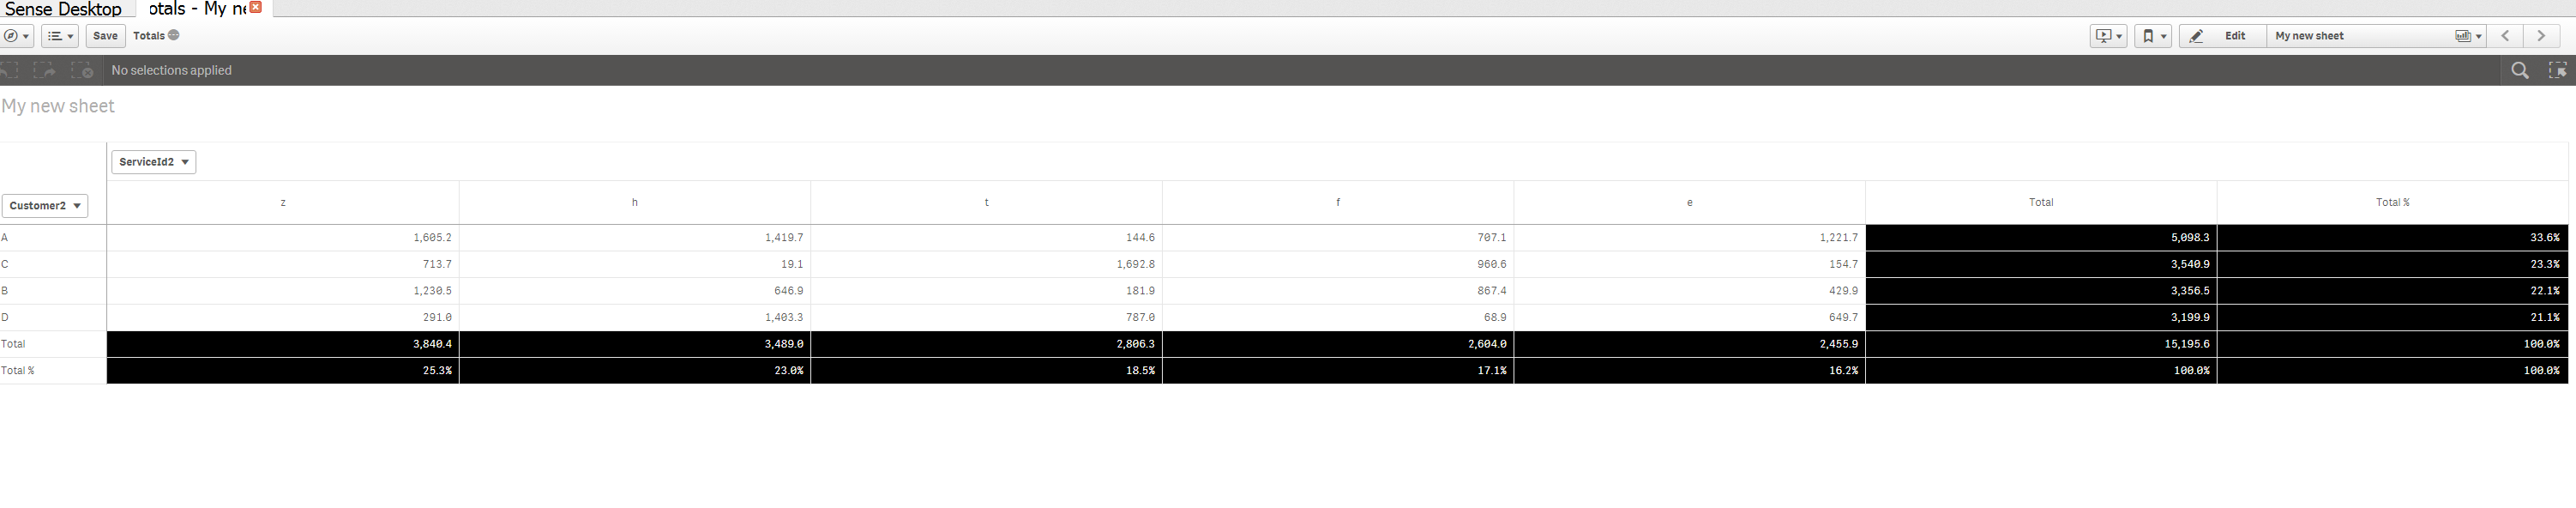
It is possible also in Qlik Sense - see attached.
cheers
Lech
- « Previous Replies
-
- 1
- 2
- Next Replies »