Unlock a world of possibilities! Login now and discover the exclusive benefits awaiting you.
- Qlik Community
- :
- All Forums
- :
- QlikView App Dev
- :
- Re: Using multiple fields on 1 axis
Options
- Subscribe to RSS Feed
- Mark Topic as New
- Mark Topic as Read
- Float this Topic for Current User
- Bookmark
- Subscribe
- Mute
- Printer Friendly Page
Turn on suggestions
Auto-suggest helps you quickly narrow down your search results by suggesting possible matches as you type.
Showing results for
Not applicable
2016-11-24
06:12 AM
- Mark as New
- Bookmark
- Subscribe
- Mute
- Subscribe to RSS Feed
- Permalink
- Report Inappropriate Content
Using multiple fields on 1 axis
Dear all,
I have a database like in the example. Now I would like to create a graph, showing the number of orders started in a given month AND the number of orders closed in a given month. An example of a graph is also given in the example below. Is there a way to combine the 2 fields (date started and date closed) for the x-axis? Or is there another easy way?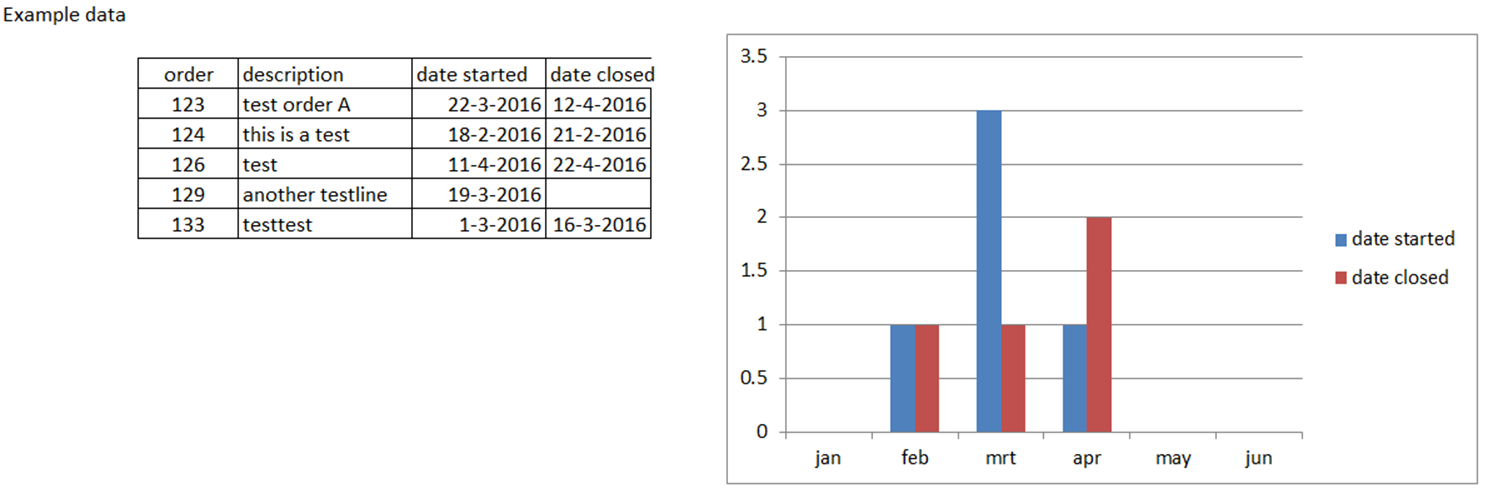
325 Views
2 Replies
MVP
2016-11-30
07:33 PM
- Mark as New
- Bookmark
- Subscribe
- Mute
- Subscribe to RSS Feed
- Permalink
- Report Inappropriate Content
264 Views
MVP
2016-12-01
01:56 AM
- Mark as New
- Bookmark
- Subscribe
- Mute
- Subscribe to RSS Feed
- Permalink
- Report Inappropriate Content
Another approach might be to match your started/closed dates with a master-calendar per IntervalMatch.
- Marcus
264 Views