Unlock a world of possibilities! Login now and discover the exclusive benefits awaiting you.
- Qlik Community
- :
- Forums
- :
- Analytics
- :
- App Development
- :
- Re: Switch between chart and data table
- Subscribe to RSS Feed
- Mark Topic as New
- Mark Topic as Read
- Float this Topic for Current User
- Bookmark
- Subscribe
- Mute
- Printer Friendly Page
- Mark as New
- Bookmark
- Subscribe
- Mute
- Subscribe to RSS Feed
- Permalink
- Report Inappropriate Content
Switch between chart and data table
Hello,
Maybe I'm missing something obvious, but I can't figure out how to allow a user to switch from a chart to a table of the data underlying the chart within a single sheet. I would like to have a toggle button or drop-down option that allows the user to choose which view.
I'd appreciate any insight you might have!
Cheers,
Tanya
- Mark as New
- Bookmark
- Subscribe
- Mute
- Subscribe to RSS Feed
- Permalink
- Report Inappropriate Content
Hi
on your object properties check out the general sheet you have to found allowed types under fast type change .choose the types you want to allow and then you will see an icon up right your object .
otherwise creat a bouton who change a variable value (1 graph , 2 table) . after that you can creat two objects (graphe and table of the data ) with conditional show ( cheet layout ) using the variable .
- Mark as New
- Bookmark
- Subscribe
- Mute
- Subscribe to RSS Feed
- Permalink
- Report Inappropriate Content
Hi Mohamed,
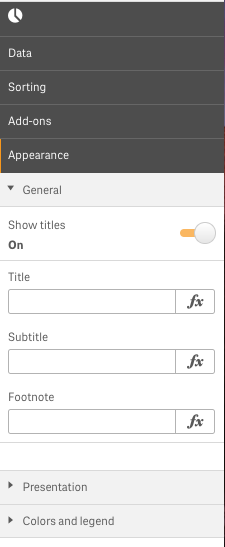
The first option sounds like what I am looking for, but I can't find how to do it. Here is what I see under the object properties, General for a pie chart. Am I looking in the wrong place?
Thanks,
Tanya
- Mark as New
- Bookmark
- Subscribe
- Mute
- Subscribe to RSS Feed
- Permalink
- Report Inappropriate Content
When you drag n drop chart from Left panel on existing created chart it will ask you to Replace or Convert. Choose convert(While dragging make sure you are covering entire space occupied by existing chart)
- Mark as New
- Bookmark
- Subscribe
- Mute
- Subscribe to RSS Feed
- Permalink
- Report Inappropriate Content
Hi Shraddha,
Thanks for the suggestion, but I do not want to permanently replace the existing chart. I would like to find a way to have both in the report so that the user (not developer) can choose which to view.
Cheers,
Tanya
- Mark as New
- Bookmark
- Subscribe
- Mute
- Subscribe to RSS Feed
- Permalink
- Report Inappropriate Content
Hi tanya
have you finally found a way ?
- Mark as New
- Bookmark
- Subscribe
- Mute
- Subscribe to RSS Feed
- Permalink
- Report Inappropriate Content
It's basic but you can right click on the chart and select view data