Unlock a world of possibilities! Login now and discover the exclusive benefits awaiting you.
- Qlik Community
- :
- All Forums
- :
- QlikView App Dev
- :
- Re: Cumulative Product in Qlik Sense
- Subscribe to RSS Feed
- Mark Topic as New
- Mark Topic as Read
- Float this Topic for Current User
- Bookmark
- Subscribe
- Mute
- Printer Friendly Page
- Mark as New
- Bookmark
- Subscribe
- Mute
- Subscribe to RSS Feed
- Permalink
- Report Inappropriate Content
Cumulative Product in Qlik Sense
Hi all,
A short question. For my project in Qlik Sense I have compute the cumulative product of a certain time series. As far as I know the way to calculate the cumulative sum is done by rangesum( above( sum([Expression1]),0,rowno())). Perhaps a variation on this expression can be made to compute a cumulative product?
Thanks in advance for your time.
Sebastian
Correct answer provided by Sunny T (somewhat easier expression):
Exp(RangeSum(Above(Log(([Expression1]), 0, RowNo())))
- « Previous Replies
-
- 1
- 2
- Next Replies »
- Mark as New
- Bookmark
- Subscribe
- Mute
- Subscribe to RSS Feed
- Permalink
- Report Inappropriate Content
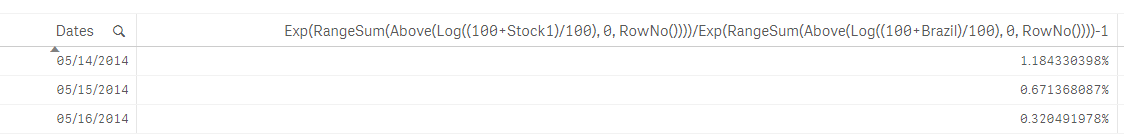
Although I am confident about this, lets take a second opinion from the expert (since I see he is already on the community right now). swuehl can you take a look at the expression I provided?
Exp(RangeSum(Above(Log((100+Stock1)/100), 0, RowNo())))/Exp(RangeSum(Above(Log((100+Brazil)/100), 0, RowNo())))-1
- Mark as New
- Bookmark
- Subscribe
- Mute
- Subscribe to RSS Feed
- Permalink
- Report Inappropriate Content
Works in Qlik Sense also
- Mark as New
- Bookmark
- Subscribe
- Mute
- Subscribe to RSS Feed
- Permalink
- Report Inappropriate Content
Sound! It seems more than correct. The difference in visualization could also be very good an issue with the data I am provided with. Please give me a day and I'll come back with you. I have to verify my data set and your suggestion with a colleague who is absent today from work.
I cannot state how much I thank you for your help. I am struggling with this "simple" problem for a while now and hopefully we've found the correct solution.
- Mark as New
- Bookmark
- Subscribe
- Mute
- Subscribe to RSS Feed
- Permalink
- Report Inappropriate Content
Take your time my friend  and trust me this is not a simple problem by any means....
Best,
Sunny
- Mark as New
- Bookmark
- Subscribe
- Mute
- Subscribe to RSS Feed
- Permalink
- Report Inappropriate Content
Hi Sunny T,
Thank you for your patience. The last few days I have tried to figure out what the 1 to 2 % difference in results caused. I am convinced this is data and not formula related. Results are looking great for all the stocks which have a correct data set.
I would like to thank you very much for your effort. This was an important task for me to fix. Now I can focus on retrieving correct data for the missing numbers. I have the difficult task to list one of your answers as correct. Do you have a preference? I think this should be the correct one. The one where you started with...:
Try this expression:
Exp(RangeSum(Above(Log((100+Stock1)/100), 0, RowNo())))/Exp(RangeSum(Above(Log((100+Brazil)/100), 0, RowNo())))-1
As I haven't seen the solution for a cumulative product come by yet on this forums, I think this could hopefully help many others as well. My final solution is a dynamic one and looks as follows (making it a percentage):
=100*(Exp(RangeSum(Above(Log((100+[$(=Mapping_Sedol)])/100), 0, RowNo())))/Exp(RangeSum(Above(Log((100+[$(="Mutation Country")])/100), 0, RowNo())))-1)
With kind regards,
Sebastian Heselaars
- Mark as New
- Bookmark
- Subscribe
- Mute
- Subscribe to RSS Feed
- Permalink
- Report Inappropriate Content
Sure, I think that makes sense . Also, you can always mark helpful responses which you think might come in handy for others to view also.
Qlik Community Tip: Marking Replies as Correct or Helpful
Best,
Sunny
- Mark as New
- Bookmark
- Subscribe
- Mute
- Subscribe to RSS Feed
- Permalink
- Report Inappropriate Content
A slightly easier variant to my question which is perhaps more understandable to others is that a cumulative product can be calculated as:
Exp(RangeSum(Above(Log(([Expression1]), 0, RowNo())))
Credits to Sunny T for coming up with the solution.
- Mark as New
- Bookmark
- Subscribe
- Mute
- Subscribe to RSS Feed
- Permalink
- Report Inappropriate Content
Agreed!!
I also want to thank you for your detailed response after getting your task accomplished. A lot of the times we help others and people don't even come back or don't do a good job of explaining what actually helped them in the end. I feel that if each of us (both poster or respondents) provide detailed information, we are going to make this community a much better place.
Best,
Sunny
- Mark as New
- Bookmark
- Subscribe
- Mute
- Subscribe to RSS Feed
- Permalink
- Report Inappropriate Content
I agree with you for more than 100%. Qlik Sense is an amazing visualization tool with much potential. Together we can make it an even better product.
- Mark as New
- Bookmark
- Subscribe
- Mute
- Subscribe to RSS Feed
- Permalink
- Report Inappropriate Content
This post help me very much.
Another way, is
Exp (RangeSum (below (Log ([expression]), 0, NoOfRows ())))
This mulitply all columns
- « Previous Replies
-
- 1
- 2
- Next Replies »