Unlock a world of possibilities! Login now and discover the exclusive benefits awaiting you.
- Qlik Community
- :
- Forums
- :
- Analytics
- :
- App Development
- :
- Re: How to show recent a 3 months regression line ...
- Subscribe to RSS Feed
- Mark Topic as New
- Mark Topic as Read
- Float this Topic for Current User
- Bookmark
- Subscribe
- Mute
- Printer Friendly Page
- Mark as New
- Bookmark
- Subscribe
- Mute
- Subscribe to RSS Feed
- Permalink
- Report Inappropriate Content
How to show recent a 3 months regression line in a 12 months bar chart
How to set up a regression line or trend line show the recent 3 months in a 12 months bar chart?
In particular, below graph show me all possible 12 months, but I only want to take show 3 months trend line? What is the possible solution?
linest_m(total aggr(if(sum([Cash_Payments]),sum([Cash_Payments])),Month),Month)*
+linest_b(total aggr(if(sum([Cash_Payments]),sum([Cash_Payments])),Month),Month)
I tried changing only({3}Month, but the regression won't show up anymore if it changes. Please help.
- « Previous Replies
-
- 1
- 2
- Next Replies »
- Mark as New
- Bookmark
- Subscribe
- Mute
- Subscribe to RSS Feed
- Permalink
- Report Inappropriate Content
Hi,
Let's see if the below script helps you:
linest_m(total aggr(if(sum({<Month={">=$(Date(AddMonths(Today(),-3), 'MMM'))<=$(Date(Today(), 'MMM'))"}>}[Cash_Payments]),sum({<Month={">=$(Date(AddMonths(Today(),-3), 'MMM'))<=$(Date(Today(), 'MMM'))"}>}[Cash_Payments])),Month),Month)*
+linest_b(total aggr(if(sum({<Month={">=$(Date(AddMonths(Today(),-3), 'MMM'))<=$(Date(Today(), 'MMM'))"}>}[Cash_Payments]),sum({<Month={">=$(Date(AddMonths(Today(),-3), 'MMM'))<=$(Date(Today(), 'MMM'))"}>}[Cash_Payments])),Month),Month)
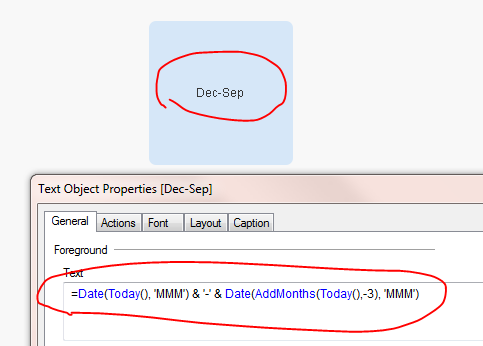
Basically, Date(Today(), 'MMM') pulls the today's date in months and Date(AddMonths(Today(),-3), 'MMM') looks back three months and pulls the month name:
Hope this helps.
Thanks
- Mark as New
- Bookmark
- Subscribe
- Mute
- Subscribe to RSS Feed
- Permalink
- Report Inappropriate Content
Hi Sinan,
When I entered the formula, it return a red line only.
- Mark as New
- Bookmark
- Subscribe
- Mute
- Subscribe to RSS Feed
- Permalink
- Report Inappropriate Content
Hi,
Do you happen to have sample data so I can try different things?
Thanks
- Mark as New
- Bookmark
- Subscribe
- Mute
- Subscribe to RSS Feed
- Permalink
- Report Inappropriate Content
sinanozdemir. Hi Sinan. Please see attached sample data. One correction, is it possible to create a regression line based on most recent, available 3 month data? Thanks so much for your help.
- Mark as New
- Bookmark
- Subscribe
- Mute
- Subscribe to RSS Feed
- Permalink
- Report Inappropriate Content
Hi,
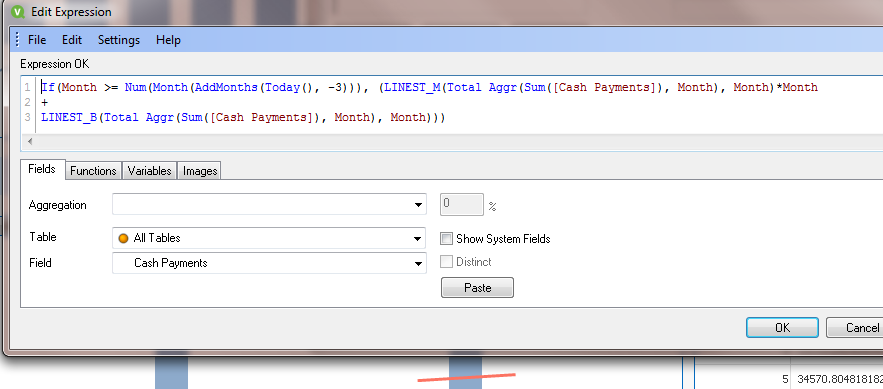
So I got R2 and Ax numbers right for the last 3 months, let me know if this is something that you are looking for
BTW, you need to use numerical values of the months.
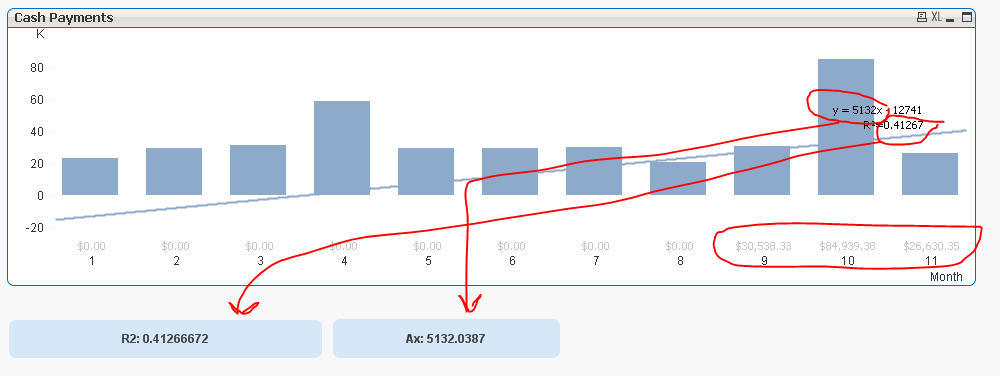
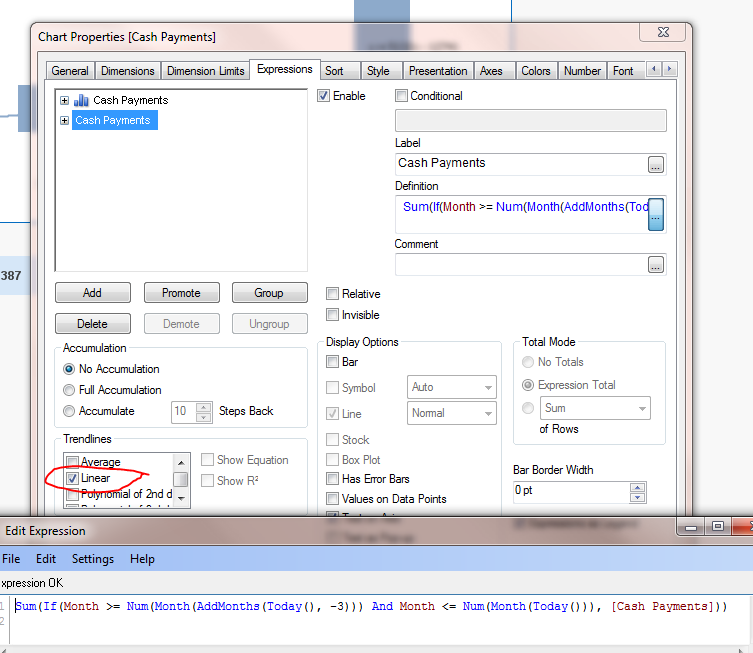
In the bar chart, I created another expression just to show the last three months cash payments and turned on the trendlines to show linear.
I am also attaching the app and I hope this helps you.
Thanks
- Mark as New
- Bookmark
- Subscribe
- Mute
- Subscribe to RSS Feed
- Permalink
- Report Inappropriate Content
Yes. Thank you.
- Mark as New
- Bookmark
- Subscribe
- Mute
- Subscribe to RSS Feed
- Permalink
- Report Inappropriate Content
One last question. I entered the formula in the measurement, and what formula should I use 3 months trend line?
- Mark as New
- Bookmark
- Subscribe
- Mute
- Subscribe to RSS Feed
- Permalink
- Report Inappropriate Content
Hi,
Well, The way how I did was to create another expression which was Sum([Cash Receipts]) and unchecked the bar box. After that for that expression, I chose to show the linear trend line.
Look at my qvw to see how I did it.
Thanks
- Mark as New
- Bookmark
- Subscribe
- Mute
- Subscribe to RSS Feed
- Permalink
- Report Inappropriate Content
Ok. So I created a combo chart. Bars are showing the cash payments and the line is showing the linear trend for the last three months. I also put a straight table showing the formula and the trend lines in numeric values:
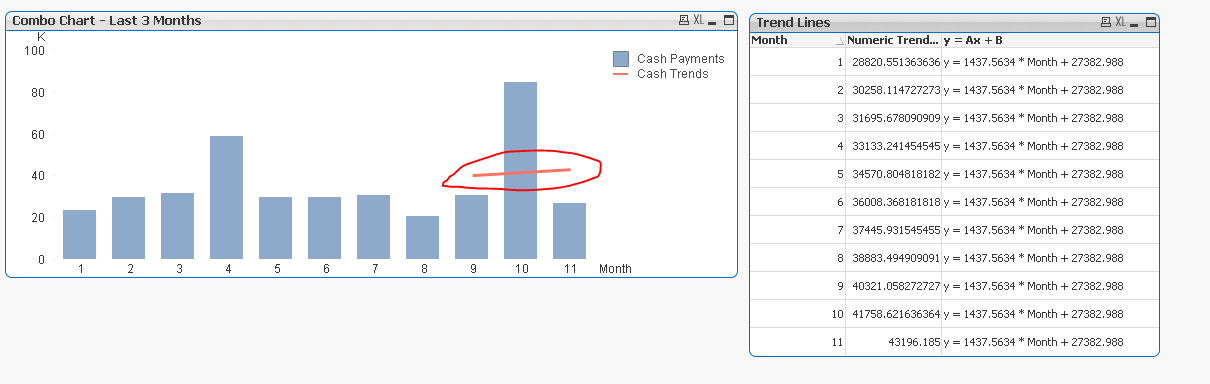
The formula for the trend line is:
I am attaching the app.
Hope this answers all of your questions and fits into your needs.
Thanks
- « Previous Replies
-
- 1
- 2
- Next Replies »