Unlock a world of possibilities! Login now and discover the exclusive benefits awaiting you.
- Qlik Community
- :
- All Forums
- :
- QlikView App Dev
- :
- Formatting text in expresssion
- Subscribe to RSS Feed
- Mark Topic as New
- Mark Topic as Read
- Float this Topic for Current User
- Bookmark
- Subscribe
- Mute
- Printer Friendly Page
- Mark as New
- Bookmark
- Subscribe
- Mute
- Subscribe to RSS Feed
- Permalink
- Report Inappropriate Content
Formatting text in expresssion
Hi All
I have a pivot table that looks something like...
| Customer | May | April | |
| A | Sales | 0 | 100 |
| Margin | 0 | 50 | |
| B | Sales | 75 | 100 |
| Margin | 35 | 50 |
Sales formula = Sum(sin_Sales)
GP formula = Sum(sin_GrossProfit)
What I want to do is show the zeros as a blank...
To do this, I visited the expresssion for each and keyed the following into the text colour property of the expression...
Sales .... =if(sum(sin_Sales) = 0, RGB(255,255,255))
GP........ =if(sum(sin_GrossProfit) =0, RGB(255,255,255))
What I end up with howver, is as follows...
| Customer | May | April | |
| A | 100 | ||
| 50 | |||
| B | Sales | 75 | 100 |
| Margin | 35 | 50 |
i.e. If the customer has no sales in the most recent month, it blanks out the values but also blanks out the row descriptor...
Is this a bug or should I be doing something different to achieve what I want?
Thanks in advance for any help you guys can give...
Regards
Paul
- « Previous Replies
-
- 1
- 2
- Next Replies »
- Mark as New
- Bookmark
- Subscribe
- Mute
- Subscribe to RSS Feed
- Permalink
- Report Inappropriate Content
Hi,
You want to show nothing when value is 0, then you should set the lower limit to 0 and text color to white.
Regards,
Kaushik Solanki
- Mark as New
- Bookmark
- Subscribe
- Mute
- Subscribe to RSS Feed
- Permalink
- Report Inappropriate Content
I am possibly not understanding visual cues properly but beside the lower limit it states <= (please see screenshot below)...
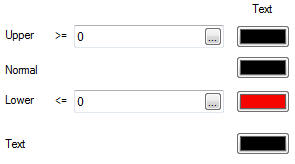
I am using the Lower limit to force values below 0 to red text...
I changed the red to white and all my negative values disappeared.
Apologies if this is just my understanding...
Thanks for your help..
Paul
- Mark as New
- Bookmark
- Subscribe
- Mute
- Subscribe to RSS Feed
- Permalink
- Report Inappropriate Content
Hi,
I am here by sending you the sample
Regards,
Kaushik Solanki
- Mark as New
- Bookmark
- Subscribe
- Mute
- Subscribe to RSS Feed
- Permalink
- Report Inappropriate Content
Thank you Kaushik can see what you meant now...
My understanding of visual cues is much better now as a result of this.
Thanks
Paul
- Mark as New
- Bookmark
- Subscribe
- Mute
- Subscribe to RSS Feed
- Permalink
- Report Inappropriate Content
Hi all
Kaushiks solution will be problematic if the numbers are not integers.
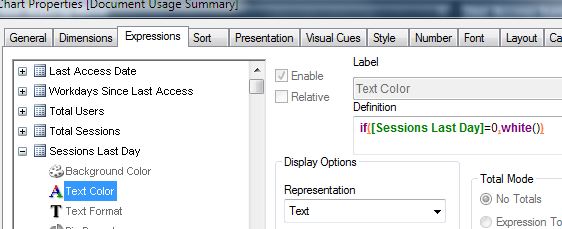
An alternative solution, that will work also for decimal numbers, is to use the Text Color attribute of the Chart column:
- Mark as New
- Bookmark
- Subscribe
- Mute
- Subscribe to RSS Feed
- Permalink
- Report Inappropriate Content
Hi,
You are right. The solution we discussed is for number's only.
You have to decide what format your data will be in. and use the solution accordingly
Regards,
Kaushik Solanki
- Mark as New
- Bookmark
- Subscribe
- Mute
- Subscribe to RSS Feed
- Permalink
- Report Inappropriate Content
Hi...
This is where I started from but have an issue with my row labels...
- Mark as New
- Bookmark
- Subscribe
- Mute
- Subscribe to RSS Feed
- Permalink
- Report Inappropriate Content
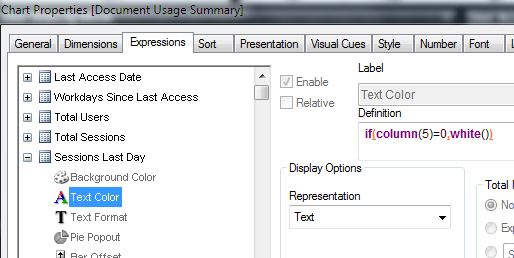
OK, then maybe you can use the column() function:
- « Previous Replies
-
- 1
- 2
- Next Replies »