Unlock a world of possibilities! Login now and discover the exclusive benefits awaiting you.
- Qlik Community
- :
- Forums
- :
- Analytics
- :
- App Development
- :
- Re: Using Set Analysis in Table Filters Dimension
- Subscribe to RSS Feed
- Mark Topic as New
- Mark Topic as Read
- Float this Topic for Current User
- Bookmark
- Subscribe
- Mute
- Printer Friendly Page
- Mark as New
- Bookmark
- Subscribe
- Mute
- Subscribe to RSS Feed
- Permalink
- Report Inappropriate Content
Using Set Analysis in Table Filters Dimension
Hi folks,
I'm having an issue with getting my data to display properly in a table. I'm using the most recent version of Qlik Sense.
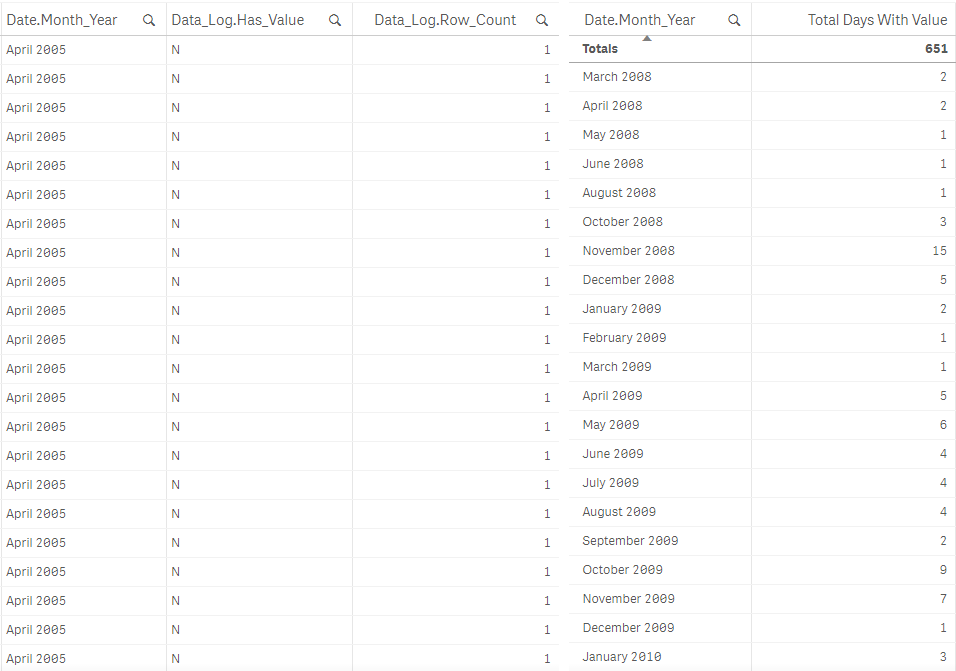
This image shows two tables, the one on the left contains dimensions showing my raw data, and the one on the right contains my Month-Year dimension with a measure that contains the expression SUM({<Data_Log.Has_Value={'Y'}>}Data_Log.Row_Count). I want to show in a table the total number "Y" values for each month-year.
For some reason, when I apply this measure to the table on the right, it filters out month-year values that don't have any "Y" values. I feel like I should see April 2005 in the table on the right with a zero value, no?. I clearly have entries for April 2005 in my data model, but it's not present in the table on the right? Why? The dimension in the right table has no limitations.
When I filter on April 2005, this is the result I get:
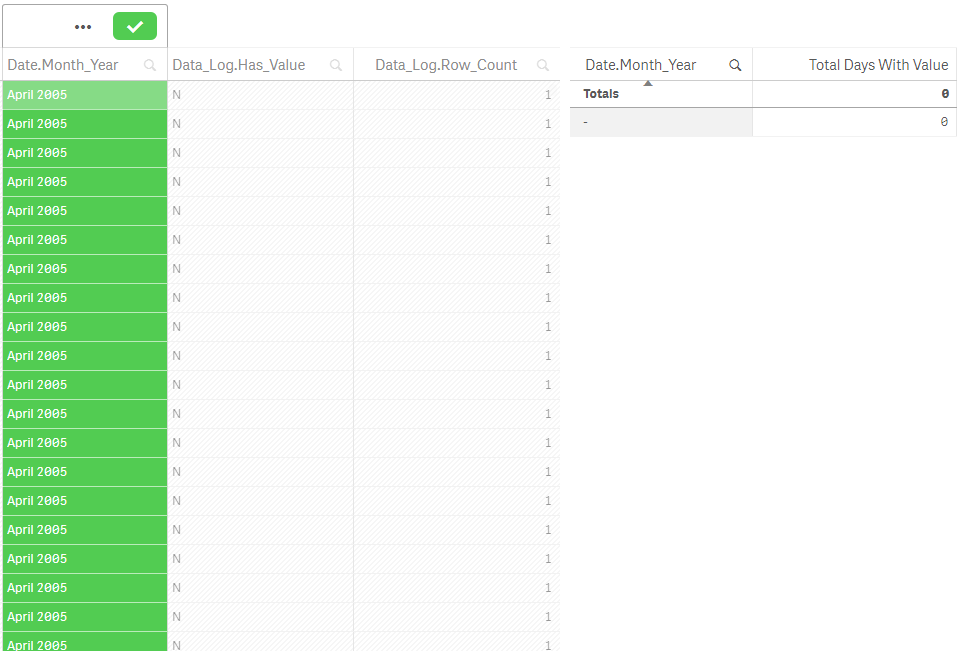
I'm confused. Any help would be appreciated!!
Accepted Solutions
- Mark as New
- Bookmark
- Subscribe
- Mute
- Subscribe to RSS Feed
- Permalink
- Report Inappropriate Content
May be try this:
Sum({<Data_Log.Has_Value={'Y'}>}[Data_Log.Row_Count]) + Avg({1} 0)
or this:
Sum({<Data_Log.Has_Value={'Y'}>}[Data_Log.Row_Count]) + Avg(0)
- Mark as New
- Bookmark
- Subscribe
- Mute
- Subscribe to RSS Feed
- Permalink
- Report Inappropriate Content
You could try it with the following: alt(SUM({<Data_Log.Has_Value={'Y'}>}Data_Log.Row_Count), 0)
- Marcus
- Mark as New
- Bookmark
- Subscribe
- Mute
- Subscribe to RSS Feed
- Permalink
- Report Inappropriate Content
Unfortunately that makes no difference... is there a fundamental reason this doesn't work? Seems pretty basic to me.
- Mark as New
- Bookmark
- Subscribe
- Mute
- Subscribe to RSS Feed
- Permalink
- Report Inappropriate Content
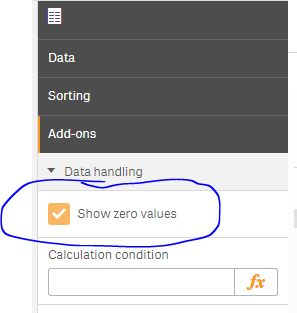
Have you made sure that 'Show zero values' is checked under Add-Ons -> Data handling?
- Mark as New
- Bookmark
- Subscribe
- Mute
- Subscribe to RSS Feed
- Permalink
- Report Inappropriate Content
Hi Sunny,
The Show zero values is checked. I've attached my QVF... If someone can maybe take a quick look I'd really appreciate it!
- Mark as New
- Bookmark
- Subscribe
- Mute
- Subscribe to RSS Feed
- Permalink
- Report Inappropriate Content
May be try this:
Sum({<Data_Log.Has_Value={'Y'}>}[Data_Log.Row_Count]) + Avg({1} 0)
or this:
Sum({<Data_Log.Has_Value={'Y'}>}[Data_Log.Row_Count]) + Avg(0)
- Mark as New
- Bookmark
- Subscribe
- Mute
- Subscribe to RSS Feed
- Permalink
- Report Inappropriate Content
Interesting. This does indeed work. Is this a standard method of forcing Qlik to have a value? Avg(0) is a pretty weird.
- Mark as New
- Bookmark
- Subscribe
- Mute
- Subscribe to RSS Feed
- Permalink
- Report Inappropriate Content
Its not a standard way to doing it, but not sure why it did not show up. May be because the data is not null but just missing (not 100% sure). So, just thought of adding Avg(0) which would add 0 to all dimensions even that have missing Data_Log.Has_Value = Y
- Mark as New
- Bookmark
- Subscribe
- Mute
- Subscribe to RSS Feed
- Permalink
- Report Inappropriate Content
Interesting. It's very strange... all dimensions seem to have a valid associated Y/N value, but it's just not working as expected. Anyways, thanks for your help finding a workaround - much appreciated!