Unlock a world of possibilities! Login now and discover the exclusive benefits awaiting you.
- Qlik Community
- :
- All Forums
- :
- QlikView App Dev
- :
- Re: Showing values on the bars in a bar chart
- Subscribe to RSS Feed
- Mark Topic as New
- Mark Topic as Read
- Float this Topic for Current User
- Bookmark
- Subscribe
- Mute
- Printer Friendly Page
- Mark as New
- Bookmark
- Subscribe
- Mute
- Subscribe to RSS Feed
- Permalink
- Report Inappropriate Content
Showing values on the bars in a bar chart
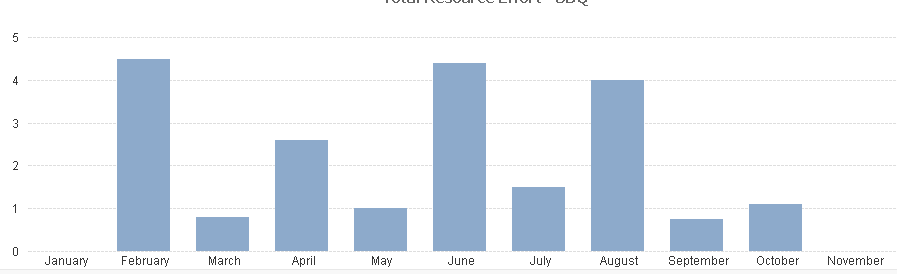
I have a bar chart with the months going across the x axis. I would like to show the value of inside the bars in the chart. For example, If in January, the value is 10, I want the number 10 to appear inside the bar for January.
I tried the recommendations from this thread, but its still not showing up:
Accepted Solutions
- Mark as New
- Bookmark
- Subscribe
- Mute
- Subscribe to RSS Feed
- Permalink
- Report Inappropriate Content
Hello P R,
before going to presentation tab
check whether you are selected the values on the data point in expression tab or not..?
- Mark as New
- Bookmark
- Subscribe
- Mute
- Subscribe to RSS Feed
- Permalink
- Report Inappropriate Content
The instructions in the discussion you linked to look fine to me. If there's enough space in the segment to plot the value then it will be shown.
Post a small qlikview document that demonstrates the problem.
talk is cheap, supply exceeds demand
- Mark as New
- Bookmark
- Subscribe
- Mute
- Subscribe to RSS Feed
- Permalink
- Report Inappropriate Content
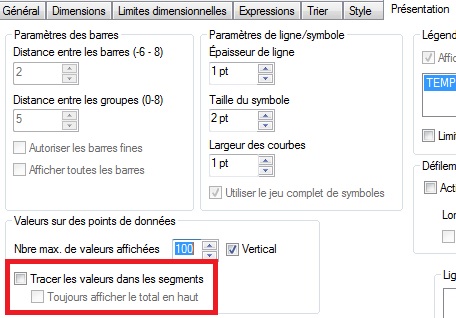
You have a check box in Presentation from Properties, Value on data point and Values inside segment.
- Mark as New
- Bookmark
- Subscribe
- Mute
- Subscribe to RSS Feed
- Permalink
- Report Inappropriate Content
Here are screenshots. i checked the box and clicked "apply" and "ok", but as you can see, they still arent appearing on the bar chart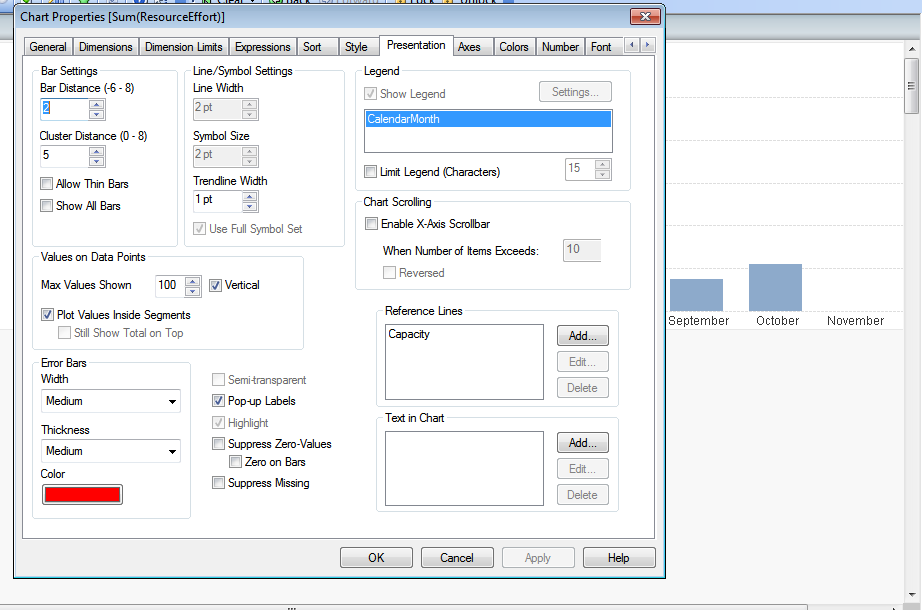
- Mark as New
- Bookmark
- Subscribe
- Mute
- Subscribe to RSS Feed
- Permalink
- Report Inappropriate Content
Hi,
go to the properties of bar chart
and
in presentation tab
you can see the values on data points
in that
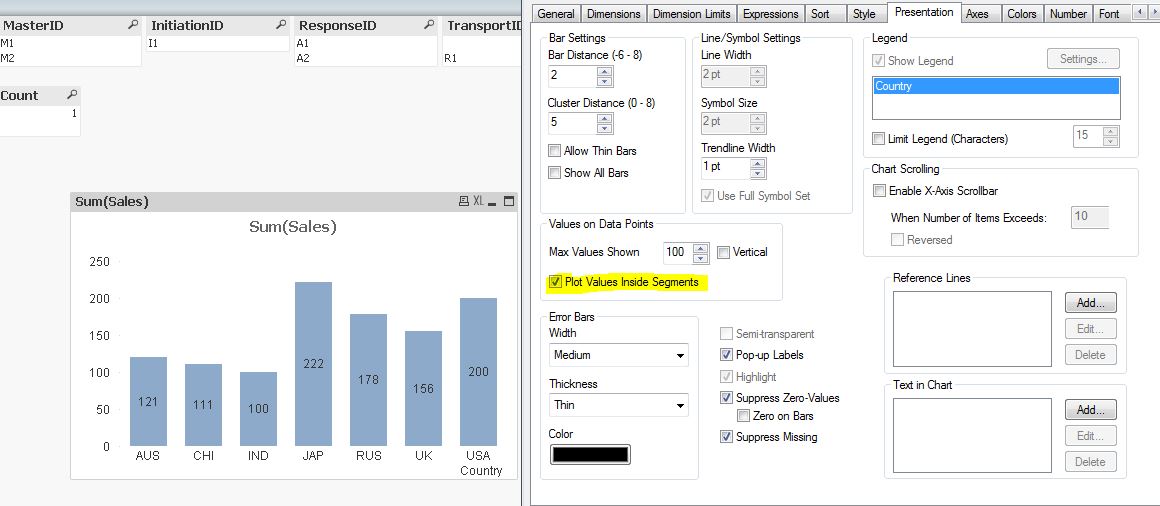
check polt the values inside the segment
then..default it display the displays the values horizontally
or if you want to display values vertically check the vertical also.
- Mark as New
- Bookmark
- Subscribe
- Mute
- Subscribe to RSS Feed
- Permalink
- Report Inappropriate Content
Hello P R,
before going to presentation tab
check whether you are selected the values on the data point in expression tab or not..?
- Mark as New
- Bookmark
- Subscribe
- Mute
- Subscribe to RSS Feed
- Permalink
- Report Inappropriate Content
Hi,
I have done the small example in that you can see I take dimension as Country and Expression as Sum of sales.
You can show the values on the bar chart as well as the inside the bar chart.
Please find the attached screen shot for your reference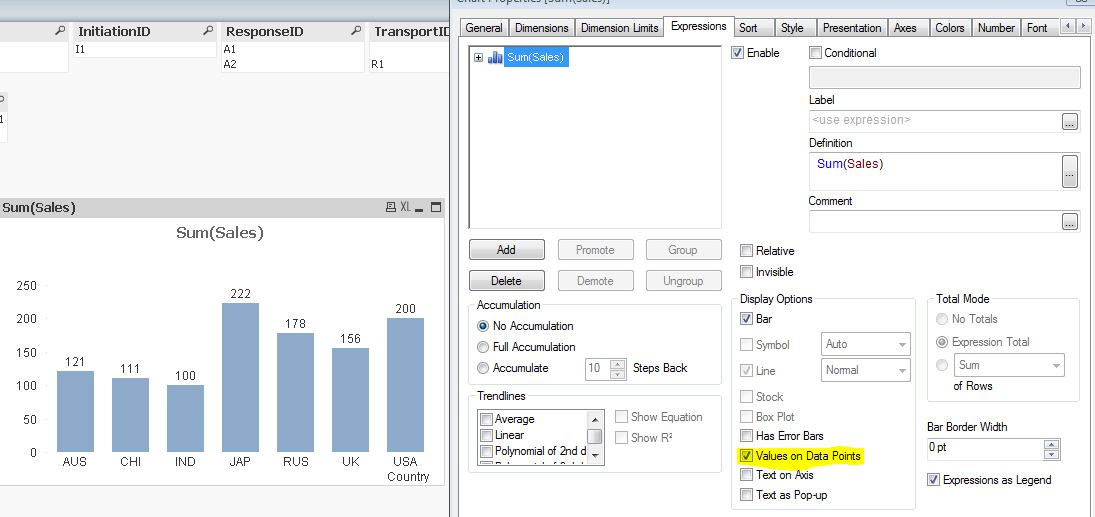
 .
.
Regards,
Yogesh J
- Mark as New
- Bookmark
- Subscribe
- Mute
- Subscribe to RSS Feed
- Permalink
- Report Inappropriate Content
Thank you Kalyani! This was the issue. It works now.
- Mark as New
- Bookmark
- Subscribe
- Mute
- Subscribe to RSS Feed
- Permalink
- Report Inappropriate Content
Thanq