Unlock a world of possibilities! Login now and discover the exclusive benefits awaiting you.
- Qlik Community
- :
- All Forums
- :
- QlikView App Dev
- :
- Re: Combo chart multiple dimensions
- Subscribe to RSS Feed
- Mark Topic as New
- Mark Topic as Read
- Float this Topic for Current User
- Bookmark
- Subscribe
- Mute
- Printer Friendly Page
- Mark as New
- Bookmark
- Subscribe
- Mute
- Subscribe to RSS Feed
- Permalink
- Report Inappropriate Content
Combo chart multiple date dimensions
Hi,
Does anyone know a simple solution to fit two different line measures with different date dimensions from each other into one graph? I am trying to visualize the cumulative returns (daily for midweek data) with the corresponding Model score (+/- weekly) for a stock.
I thought a simple combo chart will do the work, but because both measures use different dimensions (frequent vs less frequent dates) only either one will be shown correctly. My solution is to reload the less frequent measure (Model score) for the dates for which no model score is available. In this way there would be the same amount of data available for both measures and hopefully this will result in the graph I am looking for.
As this is a brand new territory for me, could someone please help me creating this script if this indeed seems the correct solution?
Thank you for your time.
Sebastian
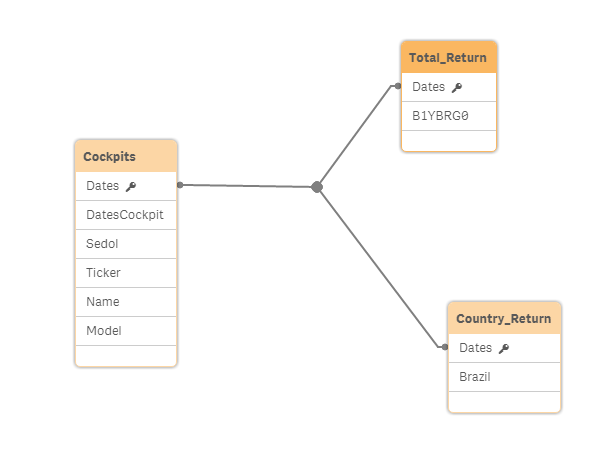
Summary: Combo chart only supports one dimension for multiple measures. How to fit two different line measures with two different date dimensions into one graph? Dimensions are called "Dates" (daily for midweek data) for returns and "DatesCockpit" (+/- weekly) for Model scores.
- Mark as New
- Bookmark
- Subscribe
- Mute
- Subscribe to RSS Feed
- Permalink
- Report Inappropriate Content
Anjos, excuse me for my late responds. You are right on the frequency of DatesCockpit and Dates. Find bellow the new pictures using your code:
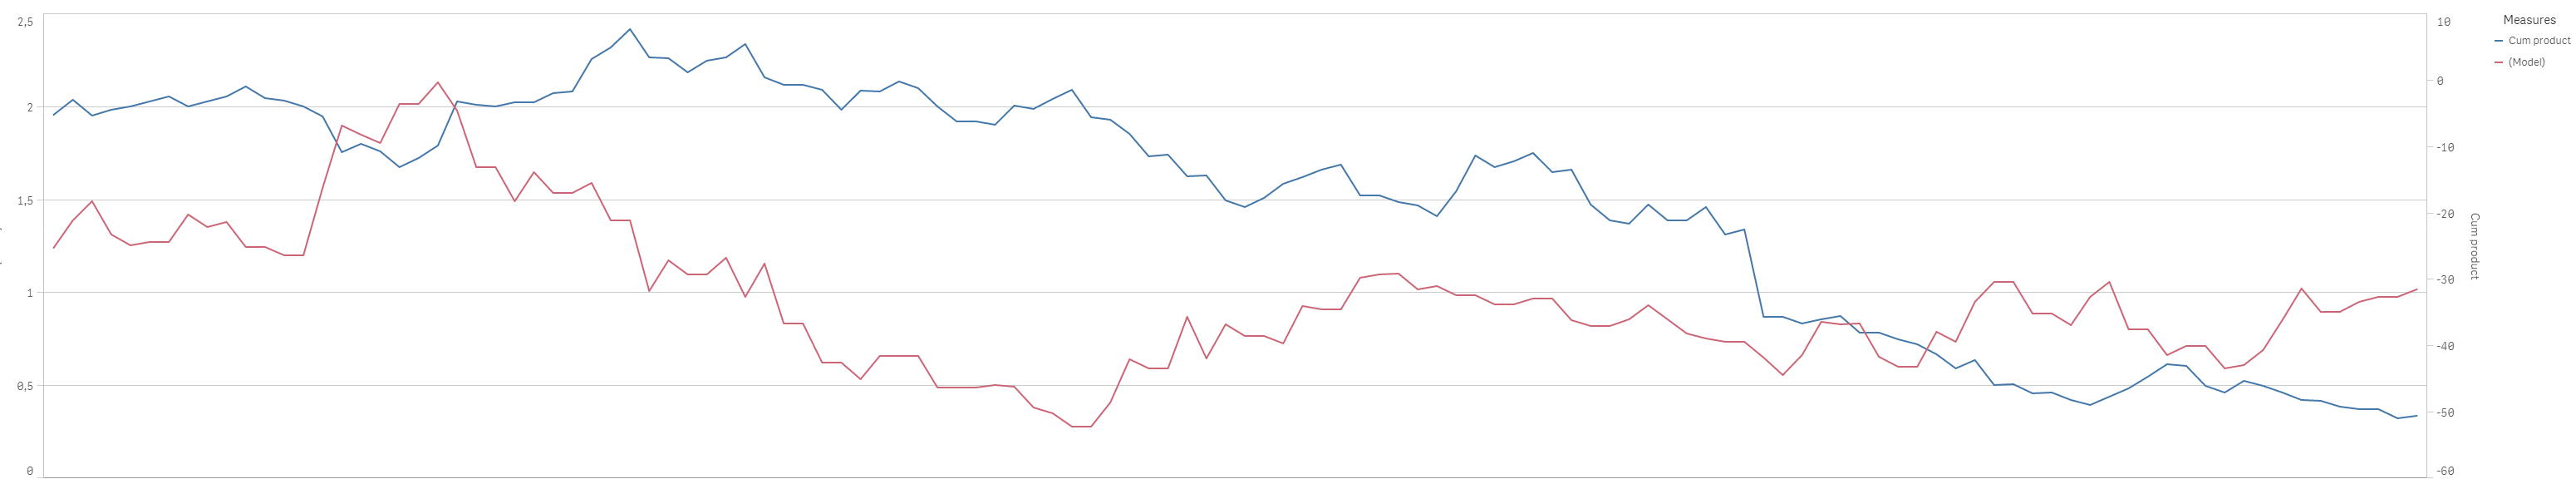
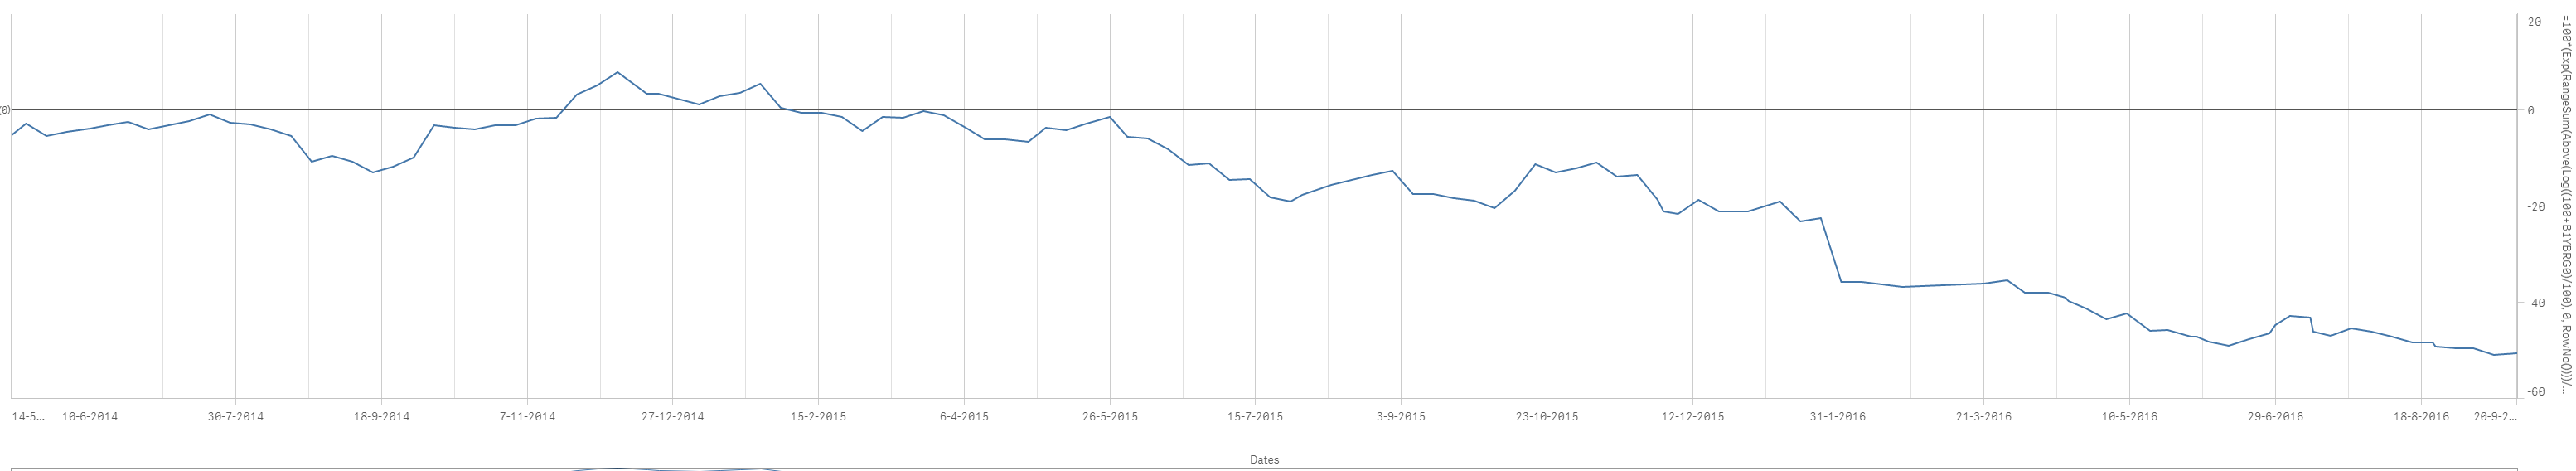
For some reason the frequency of Dates also became also weekly, instead of daily (see the second chart). The model score in the above figure is correct, the returns in the top figure are correct on a weekly basis, but I'd like to have them on a daily basis. As you can see in my earlier comment the daily returns (lowest figure) give a different outcome than the weekly returns.
- Mark as New
- Bookmark
- Subscribe
- Mute
- Subscribe to RSS Feed
- Permalink
- Report Inappropriate Content
Hi sebhesjuan
Since I am a latecomer to this thread and I have too much time to go over what has already happened, I would ask you to very briefly explain what is needed and may be the exact numbers you are looking to get? An Excel file which shows the numbers for the two lines would be great.
Best,
Sunny
- Mark as New
- Bookmark
- Subscribe
- Mute
- Subscribe to RSS Feed
- Permalink
- Report Inappropriate Content
Hi Sunny T,
In short, I need a combo chart representing two different series (Returns and Model Scores). The problem is that both series have a different frequency of dates for which numbers are available (+/- daily vs +/- weekly respectively). I have added two excel files containing the required numbers. In the "Combo Chart with correct Model Scores"-file the cumulative return is not represented well due to the difference in date frequency. Please let me know if anything remains unclear after this explanation.
With kind regards,
Sebastian
- Mark as New
- Bookmark
- Subscribe
- Mute
- Subscribe to RSS Feed
- Permalink
- Report Inappropriate Content
I understand the required output, now the question is what would you want to see in your combo chart? Daily Data or Weekly Data?
- If Daily, then Model will remain same for all dates?
- If Weekly, then how will returns show up at week level? Sum, Avg or some other aggregation of each day within the week?
- Mark as New
- Bookmark
- Subscribe
- Mute
- Subscribe to RSS Feed
- Permalink
- Report Inappropriate Content
In my combo chart I would like to see the same frequency as used for the returns (+/- daily).
However, the model score is on a weekly basis, which causes the problem. I originally thought if the model score could somehow be copied to the same frequency of dates as the return data, that this might provide the correct solution.
- Mark as New
- Bookmark
- Subscribe
- Mute
- Subscribe to RSS Feed
- Permalink
- Report Inappropriate Content
That is what I am trying to understand. Right now you have this
| DatesCockpit | (Model) |
| 14-05-2014 | 123% |
| 19-05-2014 | 138% |
This would show on a daily chart like this?
| DatesCockpit | (Model) |
| 14-05-2014 | 123% |
| 15-05-2014 | 123% |
| 16-05-2014 | 123% |
| 17-05-2014 | 123% |
| 18-05-2014 | 123% |
| 19-05-2014 | 138% |
or something else?
- Mark as New
- Bookmark
- Subscribe
- Mute
- Subscribe to RSS Feed
- Permalink
- Report Inappropriate Content
Yes, exactly. Please note that the dates of "Dates" is not exactly on a daily basis. Weekend are often omitted.
- Mark as New
- Bookmark
- Subscribe
- Mute
- Subscribe to RSS Feed
- Permalink
- Report Inappropriate Content
I am looking at your first attachement (2nd one only have weekly data for returns, so had to go to 1st attachment). Within that I am unable to get 123% for 14-05-2014? How are you getting this? Its not the Avg() or Sum() of all rows, right? What kind of aggregation do I need to get this 123%?
- Mark as New
- Bookmark
- Subscribe
- Mute
- Subscribe to RSS Feed
- Permalink
- Report Inappropriate Content
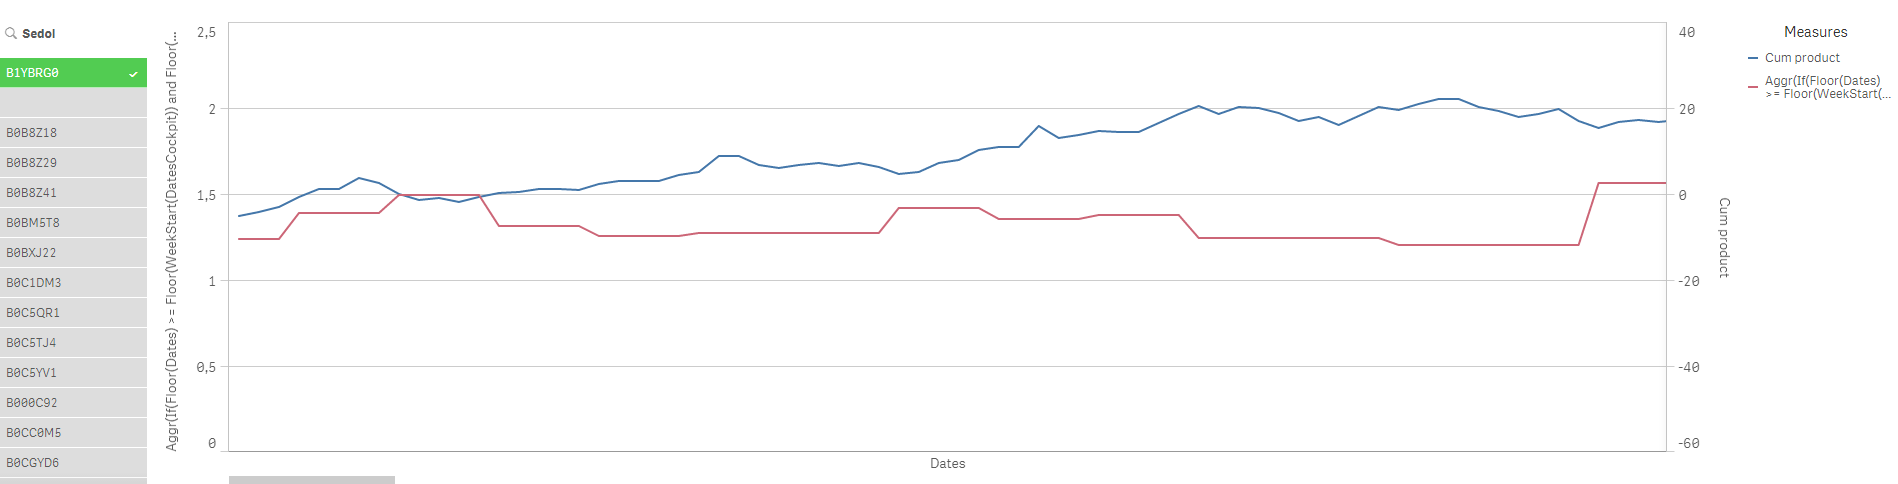
Try this for model with Dates as dimension
Aggr(If(Floor(Dates) >= Floor(WeekStart(DatesCockpit)) and Floor(Dates) <= Floor(WeekEnd(DatesCockpit)), Model), Dates, DatesCockpit)
In table, it would look like this:
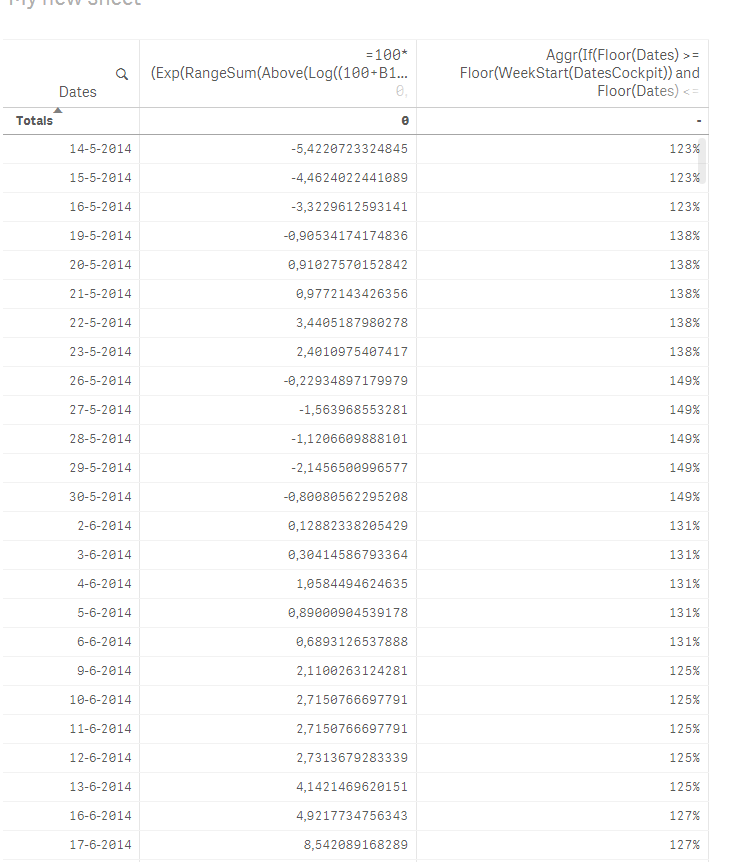
HTH
Best,
Sunny
- Mark as New
- Bookmark
- Subscribe
- Mute
- Subscribe to RSS Feed
- Permalink
- Report Inappropriate Content
Hi Sunny,
I should have stated that the Model score is not related to the return of the stock whatsoever. These are fixed numbers computed based on much different data which are not related to the returns at all.
Optimally, the combo chart should therefore give an impression to what extent the Model score indeed predicts the returns in the future.
Excuse me for the inconvenience.
Regards,
Sebhastian