Unlock a world of possibilities! Login now and discover the exclusive benefits awaiting you.
- Qlik Community
- :
- Forums
- :
- Analytics
- :
- New to Qlik Analytics
- :
- Re: rolling Chart dimension
- Subscribe to RSS Feed
- Mark Topic as New
- Mark Topic as Read
- Float this Topic for Current User
- Bookmark
- Subscribe
- Mute
- Printer Friendly Page
- Mark as New
- Bookmark
- Subscribe
- Mute
- Subscribe to RSS Feed
- Permalink
- Report Inappropriate Content
rolling Chart dimension
Hello,
I have a chart with a dimension 'By week'. this work properly if I choose weeks in my list box appropriated, but I would like to have the possibility to fix the number of the week... for example the Week to date + the 3 previous one.
frankly speaking I don't know how I can do that.
please, I need your help.
thank you in advance.
- Tags:
- patrou
- Mark as New
- Bookmark
- Subscribe
- Mute
- Subscribe to RSS Feed
- Permalink
- Report Inappropriate Content
Week to date + the 3 previous one?
I'm not sure what you're asking, can you explain more in detail?
May be screenshots of what you want/output?
- Mark as New
- Bookmark
- Subscribe
- Mute
- Subscribe to RSS Feed
- Permalink
- Report Inappropriate Content
Hello Aehman,
in more easy words, how can we defined a period (Week, Month, ...) as dimension without using a list box.
hoping that it's will more understandable for you 😉
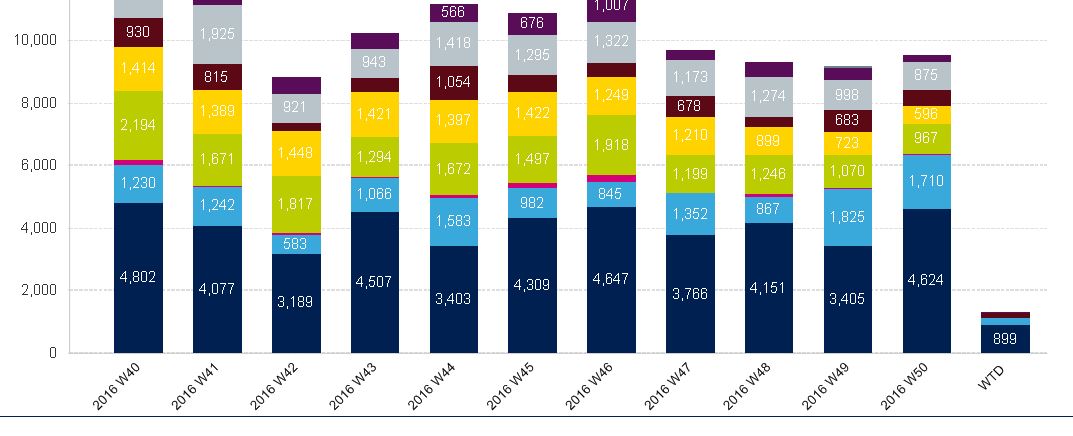
below an example of chart and the number that I talking about are those in absciss.
Thank you in advance for your help.
- Mark as New
- Bookmark
- Subscribe
- Mute
- Subscribe to RSS Feed
- Permalink
- Report Inappropriate Content
Hi
In your bar chart
Keep your dimension "By week"
then as mesure somthink like this to adapt depending of the name of your field
sum({$<[By week]={'>=$(=week(today())-4)<$(=week(today()))'}>}Sales)
it will give you from the current week the last 4 weeks available
hope it helps
- Mark as New
- Bookmark
- Subscribe
- Mute
- Subscribe to RSS Feed
- Permalink
- Report Inappropriate Content
thank you for your answer, I've difficulties to transpose in my development (it show me only the last week 😞 ). could you know where I can find some documentation to help me to understand the signification of the {}, <>..... or can you explain briefly to me ?
thank you again.
regards
Patrick
- Mark as New
- Bookmark
- Subscribe
- Mute
- Subscribe to RSS Feed
- Permalink
- Report Inappropriate Content
I do not know if you want your chart to look like the image you've provided. If yes, then use
| week(weekstart(YourDateField)) & '-' & WeekYear(TempDate) | as [Week Year], | ||||||||||
| week(weekstart(YourDateField)) & '-' & Month(TempDate) | as [Week Month], | ||||||||||
| weekDay(YourDateField) as [Week Day], |
In your Master Calendar, specifically[Week Year] will give you 1-2016,2-2016,3-2016....Week-Year.
And use Week Year as Dimension.
And for WTD expression in front end
Sum({<Year=, Month=, Quarter=, Week=, DateField=, DateNum={">=$(=Num(WeekStart(Max(DateNum))))<=$(=Max(DateNum))"}>} YourDimensionHere)
To me your requirement is not still clear.
Week,Month,Year,Quarter,Rolling Month,Year or Quarter all can be created in Script.
You want rolling 3 weeks or rolling months or year?
I'm sorry this is what I've understood from your reply.. If you've a sample image of an output you looking for? And the above image is Stacked bar, which will use more than 1 expression.
- Mark as New
- Bookmark
- Subscribe
- Mute
- Subscribe to RSS Feed
- Permalink
- Report Inappropriate Content
Those are Set Analysis functions..
Set Analysis: syntaxes, examples
Best way to get a help here is
Maybe upload a sample data or qvw
Provide a screenshot
Paste the expression you're trying to use in your chart
Expected result...
So that maybe an expert can help you?