Unlock a world of possibilities! Login now and discover the exclusive benefits awaiting you.
- Qlik Community
- :
- Forums
- :
- Analytics
- :
- New to Qlik Analytics
- :
- Map View Measure- Display negative points in red.(...
- Subscribe to RSS Feed
- Mark Topic as New
- Mark Topic as Read
- Float this Topic for Current User
- Bookmark
- Subscribe
- Mute
- Printer Friendly Page
- Mark as New
- Bookmark
- Subscribe
- Mute
- Subscribe to RSS Feed
- Permalink
- Report Inappropriate Content
Map View Measure- Display negative points in red.(Qlik Sense Desktop)
Qlik Sense Desktop
Hi,
I'm having trouble in Map View and specifically with measures.
My map currently shows a measure and the formulas is this Sum(TotalSales)-Sum(BudgetPlan).
There are several points in my map that have negative values because of this formula and they are correct since some of our sales will be under BudgetPlan.
I want the map to display anything under -.0001 as yellow/red. Essentially I want the Color scheme - Diverging classes to show the negative values in the yellow/red range and anything positive in the light blue/ dark blue color scheme.
I tried using the Colors and Legend by using Expression and Measure but it's not working out correctly. Some of my negative numbers are showing in the light blue/dark blue class which is not want I want to show.
I know there is a Custom Range option but I don't know how to correctly use that or if it's the right tool for what I'm looking for.
Thank you in advance for your help.
Accepted Solutions
- Mark as New
- Bookmark
- Subscribe
- Mute
- Subscribe to RSS Feed
- Permalink
- Report Inappropriate Content
Maybe try this one in Custom Colors?
Assuming you're using Default Map that come along with Qlik Sense.
if (Sum(TotalSales)-Sum(BudgetPlan)<=0,yellow(), if (Sum(TotalSales)-Sum(BudgetPlan)>=1,LighBlue() ))
- Mark as New
- Bookmark
- Subscribe
- Mute
- Subscribe to RSS Feed
- Permalink
- Report Inappropriate Content
Your code works very well. It shows negative locations in red.
Do you know if there is away to show it by Divergin Classes? Essentially a gradient measure going from Light Red to Dark red for negative numbers and vise versa for the positive numbers.
Thank you very much for your help.
- Mark as New
- Bookmark
- Subscribe
- Mute
- Subscribe to RSS Feed
- Permalink
- Report Inappropriate Content
I don't think we have that option in this Map.
But you need to modify your expression more (check in community how to use multiple if conditions)
I'm not sure if it will work or not but maybe like below?
You can assign single color to single value using if condition....
Ex:
if (Sum(TotalSales)-Sum(BudgetPlan)=0,yellow(),
if (Sum(TotalSales)-Sum(BudgetPlan)<0,RGb(255,232,121),
if (Sum(TotalSales)-Sum(BudgetPlan)=1,Blue() ,
if (Sum(TotalSales)-Sum(BudgetPlan)>1,LighBlue() ))))
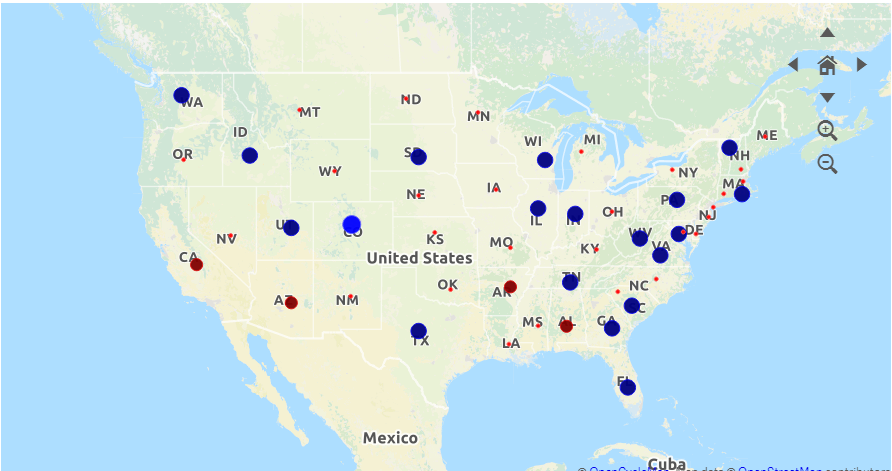
In above image
Small bubbles are light red and less than 0 (size also changes), red are =0 and so on...
Check SVG Map Extension as well (Polygon Map needs 2 digit Country/state/Region ISO code), I guess it has lighter to darker color based on higher or lower number....
- Mark as New
- Bookmark
- Subscribe
- Mute
- Subscribe to RSS Feed
- Permalink
- Report Inappropriate Content
Got it
You are probably right about using an extension to do this.
I think doing multiple IF statements only complicates things and has greater potential for errors.
Thank you for your help though! I think what you gave me will work as it gives negative points our budget targets.
