Unlock a world of possibilities! Login now and discover the exclusive benefits awaiting you.
- Qlik Community
- :
- Forums
- :
- Analytics
- :
- New to Qlik Analytics
- :
- Re: QlikSense Bar Chart - How can we display the l...
- Subscribe to RSS Feed
- Mark Topic as New
- Mark Topic as Read
- Float this Topic for Current User
- Bookmark
- Subscribe
- Mute
- Printer Friendly Page
- Mark as New
- Bookmark
- Subscribe
- Mute
- Subscribe to RSS Feed
- Permalink
- Report Inappropriate Content
QlikSense Bar Chart - How can we display the legends when using the custom color by expression ?
Hello,
Here's my bar chart:
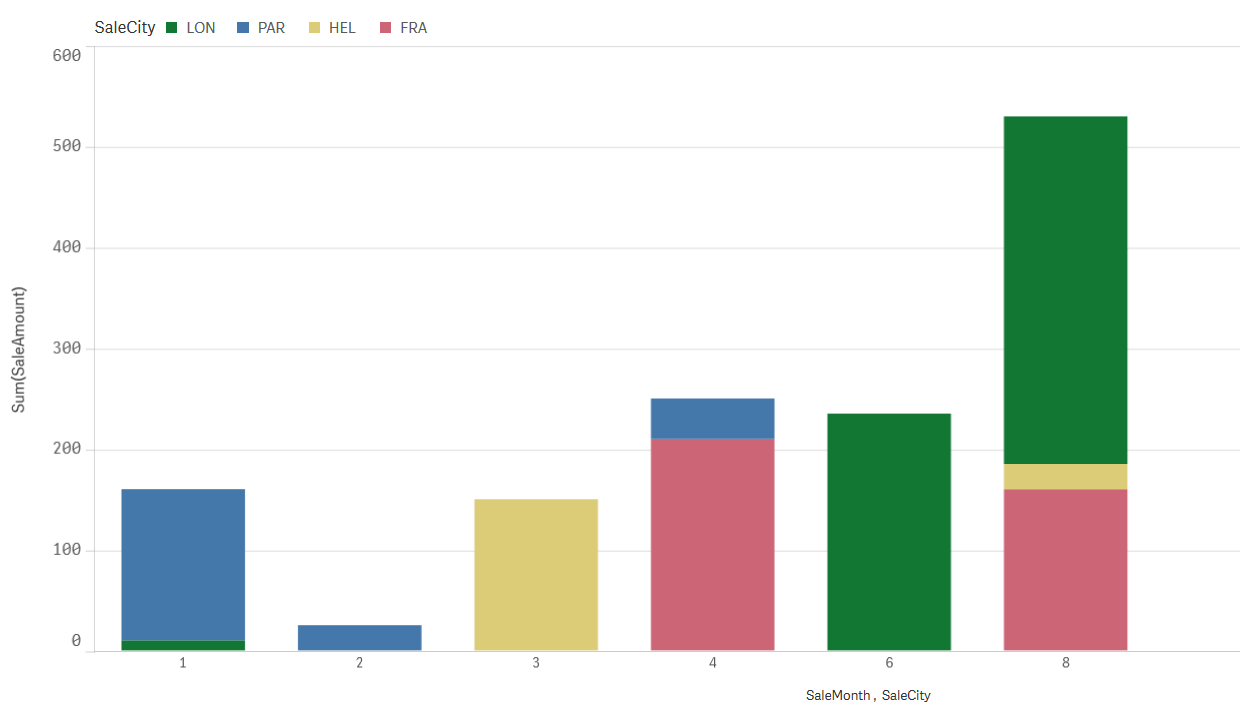
The colors are automatically selected by Qlik, I can see the legends with the city codes.
I would like to assign a color to each city using the Custom by expression. this works fine but the legends disappear.
Is there a way to display the legends, while using the color by expression?
Many thanks in advance
Annick
- Mark as New
- Bookmark
- Subscribe
- Mute
- Subscribe to RSS Feed
- Permalink
- Report Inappropriate Content
I don't think so it is possible.
I'm not aware of any extension either which have legends+custom color.
- Mark as New
- Bookmark
- Subscribe
- Mute
- Subscribe to RSS Feed
- Permalink
- Report Inappropriate Content
you can show legends by using Simple table.
Use Dimension as City and Use measure as 1 and in Background color and Text color use your expression for color(Same expression you used in Bar chart in Color by Expression)