Unlock a world of possibilities! Login now and discover the exclusive benefits awaiting you.
- Qlik Community
- :
- All Forums
- :
- QlikView App Dev
- :
- Group Two Charts for Simultaneous Autominimize
- Subscribe to RSS Feed
- Mark Topic as New
- Mark Topic as Read
- Float this Topic for Current User
- Bookmark
- Subscribe
- Mute
- Printer Friendly Page
- Mark as New
- Bookmark
- Subscribe
- Mute
- Subscribe to RSS Feed
- Permalink
- Report Inappropriate Content
Group Two Charts for Simultaneous Autominimize
All,
Is there a way that I can link or group two chart together (visually) not necessarily via the underlying data. I have two charts that I would like to display together as they display complementary data - however, if one of the other charts on the worksheet is activated I would like both complementary sheets to autominimize. Likewise, if one of the "grouped" charts is selected, I would like both to be displayed.
Cheers
Ian
- Tags:
- new_to_qlikview
Accepted Solutions
- Mark as New
- Bookmark
- Subscribe
- Mute
- Subscribe to RSS Feed
- Permalink
- Report Inappropriate Content
Hi Ian,
There is no way currently in qlikview of "grouping" objects together.
You could achieve what you want via macros. Create macros to restore/minimize your 2 charts with code something like this:
Sub RestoreCharts
set c=ActiveDocument.GetSheetObject("1stChartObjectIDhere")
c.restore
end sub
Sub MinimizeCharts
set c=ActiveDocument.GetSheetObject("1stChartObjectIDhere")
c.minimize
end sub
then from the Sheet->Properties->Macro page set SheetObjectEventTriggers to call your macros for OnActivate on the objects you want.
I am on v8.5 so perhaps more recent versions will allow you to do more interesting things using Actions which woudl avoid the use of macros.
- Mark as New
- Bookmark
- Subscribe
- Mute
- Subscribe to RSS Feed
- Permalink
- Report Inappropriate Content
Worked like a charm . . . I did add a line or two . . .
Firstly when I restored the "group" of charts I wanted to display, I minimized all the other charts on the sheet as well. I also added a set vCharID= and vCharID.restore for each vCharID.
Thanks so much Pat. Awesome.
- Mark as New
- Bookmark
- Subscribe
- Mute
- Subscribe to RSS Feed
- Permalink
- Report Inappropriate Content
Hi!
I too faced a similar problem...so i wrote some macros in the 'EditModule' dialogue.
Sub RestoreChartsCH02
set c=ActiveDocument.GetSheetObject("CH04")
c.restore
end sub
Sub MinimizeChartsCH02
set c=ActiveDocument.GetSheetObject("CH04")
c.minimize
end sub
Sub RestoreChartsCH04
set c=ActiveDocument.GetSheetObject("CH02")
c.restore
end sub
Sub MinimizeChartsCH04
set c=ActiveDocument.GetSheetObject("CH02")
c.minimize
end sub
Then I went to Sheet->Properties->Triggers->OnActivate->MinimizeObject and RestoreObject....i call the corresponding macros...but nothing happens when I minimize or restore either of the sheet objects...
Is there something wrong in the way I have done it?...
Thanks in advance...
-Anju
- Mark as New
- Bookmark
- Subscribe
- Mute
- Subscribe to RSS Feed
- Permalink
- Report Inappropriate Content
 Hi,
Hi,
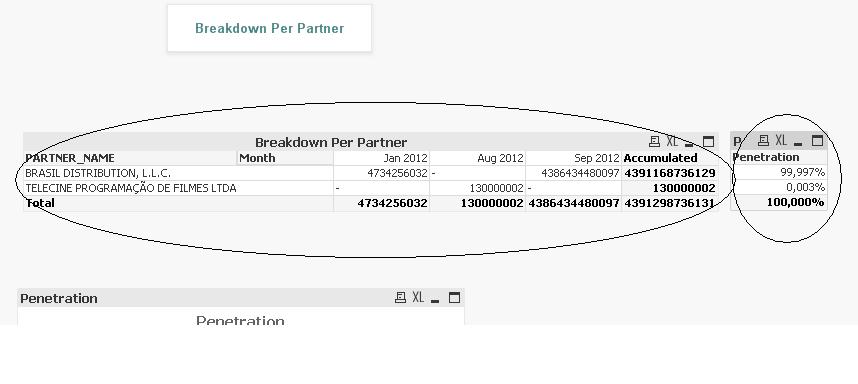
Below I have an attached an image showing my problem...I have circled the two charts.
In the first chart, I find the partial sum...So, it is not possible for me to add another expression after 'TOTAL'. So, I add another chart to calculate penetration where I have hidden the first column. Now, I want the two charts to look as one..So, I used the subroutines as mentioned above. But it is not behaving as expected.
Is there any way to solve this issue?
Thanks,
Anju
- Mark as New
- Bookmark
- Subscribe
- Mute
- Subscribe to RSS Feed
- Permalink
- Report Inappropriate Content
Or , alternately, is there any way that I could maintain chart two's position relative to the first one at runtime...so that whenever user changes the position of the first chart, the second chart would also occupy a relative position and also vice versa?
I also came across this...
http://community.qlik.com/message/85654#85654
where they have used some expressions like this..
avg({$<"2ndDimension"={'length fitness'}>} [Average r...])
avg({$<"2ndDimension"={'length fitness'}>} [Average d...])
avg({$<"2ndDimension"={'overlap fitness'}>} [Average r...])
avg({$<"2ndDimension"={'overlap fitness'}>} [Average d...])
Is it possible for me to use something like this to control chart positions at runtime?
Any help will be much appreciated.
Thanks,
Anju