Unlock a world of possibilities! Login now and discover the exclusive benefits awaiting you.
- Qlik Community
- :
- All Forums
- :
- QlikView App Dev
- :
- Re: total previous quarters - offset in bar chart
- Subscribe to RSS Feed
- Mark Topic as New
- Mark Topic as Read
- Float this Topic for Current User
- Bookmark
- Subscribe
- Mute
- Printer Friendly Page
- Mark as New
- Bookmark
- Subscribe
- Mute
- Subscribe to RSS Feed
- Permalink
- Report Inappropriate Content
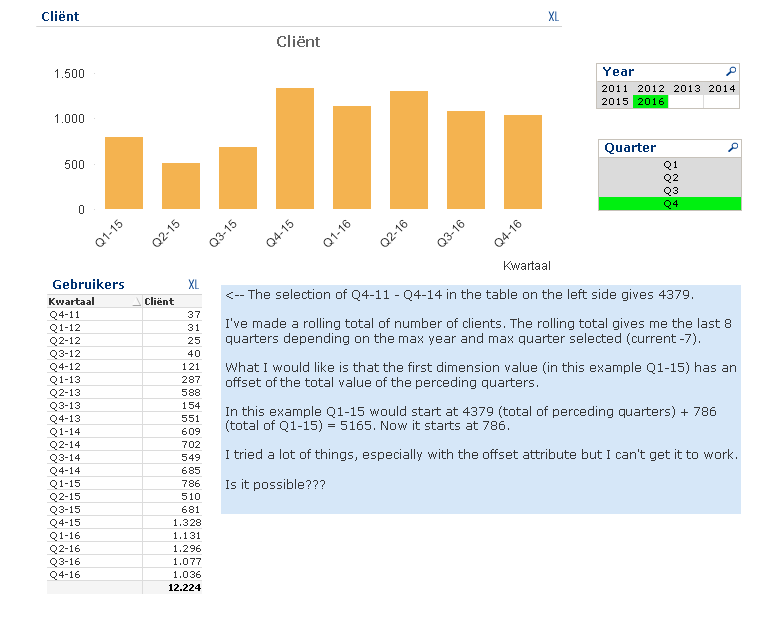
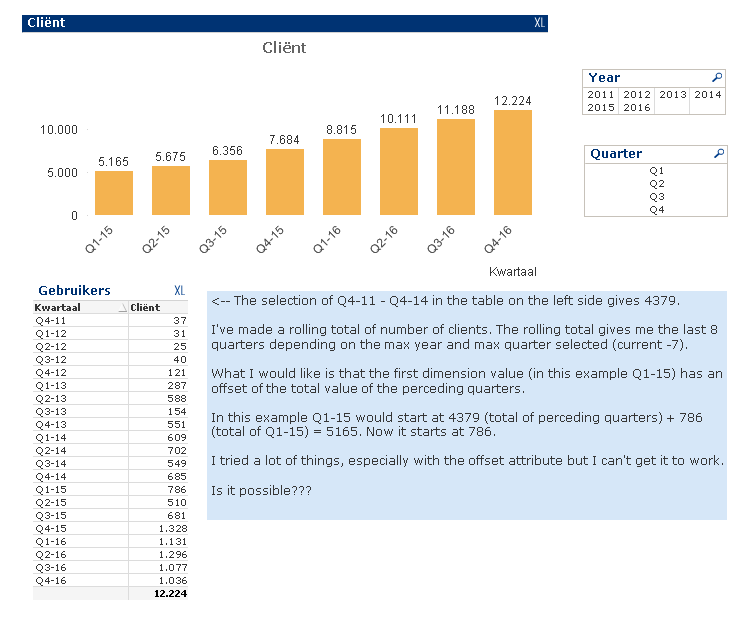
total previous quarters - offset in bar chart
Hi developers,
I have a question, example application attached.
I really hope that someone can help me and knows the solution. Thanks in advance!!!
Regards,
Stefan
Accepted Solutions
- Mark as New
- Bookmark
- Subscribe
- Mute
- Subscribe to RSS Feed
- Permalink
- Report Inappropriate Content
Is this what you want to get?
Expression
RangeSum(Above(Sum({<Year=, Quarter=, QuarterYear=, Month=, Week=, Date=, RolID={1}>}UserCounter), 0, RowNo())) * Avg({<Year=, Quarter=, Month=, QuarterYear=, Week=, Date={'>=$(=QuarterStart(Max(Date), -7))<=$(=Date(Max(Date)))'},RolID={1}>}1)
- Mark as New
- Bookmark
- Subscribe
- Mute
- Subscribe to RSS Feed
- Permalink
- Report Inappropriate Content
Sunny T, you're the man! Thanks a lot! 
regards,
Stefan
- Mark as New
- Bookmark
- Subscribe
- Mute
- Subscribe to RSS Feed
- Permalink
- Report Inappropriate Content
not sure do you just need this?
=RangeSum(Above(Sum({<Year=, Quarter=, QuarterYear=, Month=, Week=, Date=, RolID={1}>}UserCounter), 0, RowNo()))
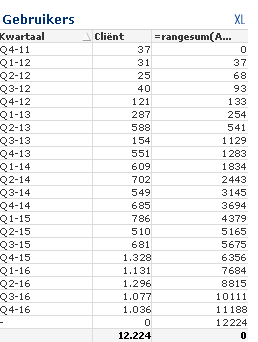
If a post helps to resolve your issue, please accept it as a Solution.
- Mark as New
- Bookmark
- Subscribe
- Mute
- Subscribe to RSS Feed
- Permalink
- Report Inappropriate Content
Thanks Vineeth, that is part of the trick! Sunny T used that also.
What I wanted is Sunny T's solution. Thanks again!
regards Stefan
- Mark as New
- Bookmark
- Subscribe
- Mute
- Subscribe to RSS Feed
- Permalink
- Report Inappropriate Content
Hi Sunny,
I've reviewed your solution, trying to understand it.
Why do you use the second part?
* Avg({<Year=, Quarter=, Month=, QuarterYear=, Week=, Date={'>=$(=QuarterStart(Max(Date), -7))<=$(=Date(Max(Date)))'},RolID={1}>}1) always seems to give 1.
When I only use the first part of you expression it also works.
Am I missing something (important)?
Regards,
Stefan
- Mark as New
- Bookmark
- Subscribe
- Mute
- Subscribe to RSS Feed
- Permalink
- Report Inappropriate Content
Sorry now I get it, it's to keep the 8 rolling quarters. Nevermind.
Regards,
Stefan
- Mark as New
- Bookmark
- Subscribe
- Mute
- Subscribe to RSS Feed
- Permalink
- Report Inappropriate Content
If you remove the Avg(.... 1) part don't you see all the months?
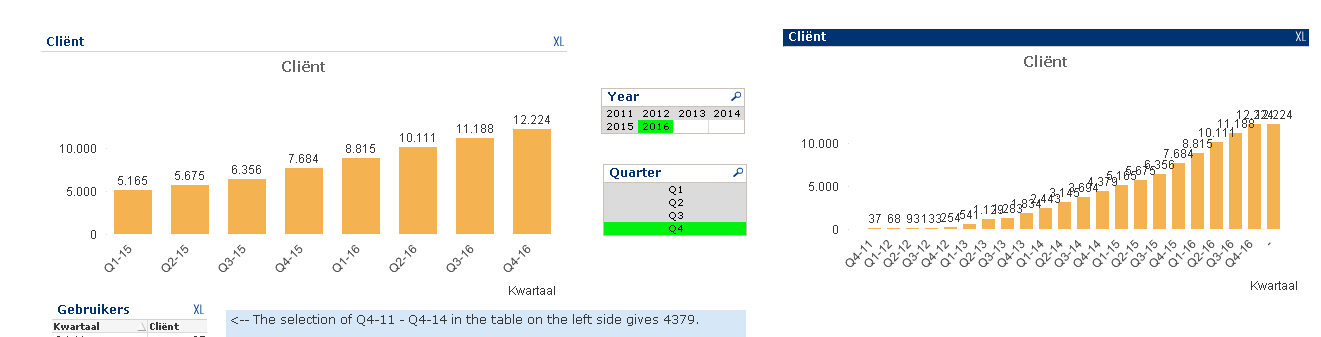
The chart on the right doesn't use Avg(1) and you are seeing all the quarters and not just the 8 quarters? Do you wish to see all quarters?
- Mark as New
- Bookmark
- Subscribe
- Mute
- Subscribe to RSS Feed
- Permalink
- Report Inappropriate Content
Hahahaha yes, absolutely. Avg is only 1 for the 8 quarters and 0 otherwise.