Unlock a world of possibilities! Login now and discover the exclusive benefits awaiting you.
- Qlik Community
- :
- All Forums
- :
- QlikView App Dev
- :
- Re: Want to have a block chart in two colors only
- Subscribe to RSS Feed
- Mark Topic as New
- Mark Topic as Read
- Float this Topic for Current User
- Bookmark
- Subscribe
- Mute
- Printer Friendly Page
- Mark as New
- Bookmark
- Subscribe
- Mute
- Subscribe to RSS Feed
- Permalink
- Report Inappropriate Content
Want to have a block chart in two colors only
Hi Gurus,
I am new to Qlik view and I am developing a Warehouse KPI. I want to show the BIN position as Empty or Full. I have multiple Bins in an Aile, so I have to represent it as Empty or Full.
I am making a Block Chart and couldn't able to represent it in only two colors. My data is :
LOAD * INLINE [
F1, F2
A11A, 1
A11B, 0
A12A, 1
A12B, 1
A13A, 0
A13B, 0
A14A, 1
A14B, 0
];
Need advice.
Regards
Imran
- Mark as New
- Bookmark
- Subscribe
- Mute
- Subscribe to RSS Feed
- Permalink
- Report Inappropriate Content
Don't use F2 as expression. Zero values will mean a surface areas of zero. In other words areas that can't be shown. Use 1 as area size:
LOAD *, 1 as AreaSize INLINE [
F1, F2
A11A, 1
A11B, 0
A12A, 1
A12B, 1
A13A, 0
A13B, 0
A14A, 1
A14B, 0
];
Then in your block chart use F1 and F2 as dimensions and sum(AreaSize) as expression.
talk is cheap, supply exceeds demand
- Mark as New
- Bookmark
- Subscribe
- Mute
- Subscribe to RSS Feed
- Permalink
- Report Inappropriate Content
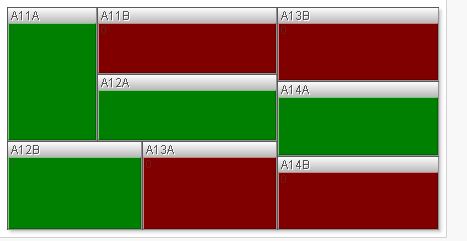
This is what you want??
- Mark as New
- Bookmark
- Subscribe
- Mute
- Subscribe to RSS Feed
- Permalink
- Report Inappropriate Content
Yup and gysbert reply fulfilled my requirement.
- Mark as New
- Bookmark
- Subscribe
- Mute
- Subscribe to RSS Feed
- Permalink
- Report Inappropriate Content
You can directly give 1 in your expression instead of inline also.
In expression just give 1 instead of F2