Unlock a world of possibilities! Login now and discover the exclusive benefits awaiting you.
- Qlik Community
- :
- Forums
- :
- Analytics
- :
- App Development
- :
- Totals in the pivot table in Qlik Sense
- Subscribe to RSS Feed
- Mark Topic as New
- Mark Topic as Read
- Float this Topic for Current User
- Bookmark
- Subscribe
- Mute
- Printer Friendly Page
- Mark as New
- Bookmark
- Subscribe
- Mute
- Subscribe to RSS Feed
- Permalink
- Report Inappropriate Content
Totals in the pivot table in Qlik Sense
Hello experts,
I'm struggling to get the right total amounts in the Pivot table in Qlik Sense.
Here's a simplified example of the problem:
I have a pivot table with a Cohort, Age and relevant amount for every age:
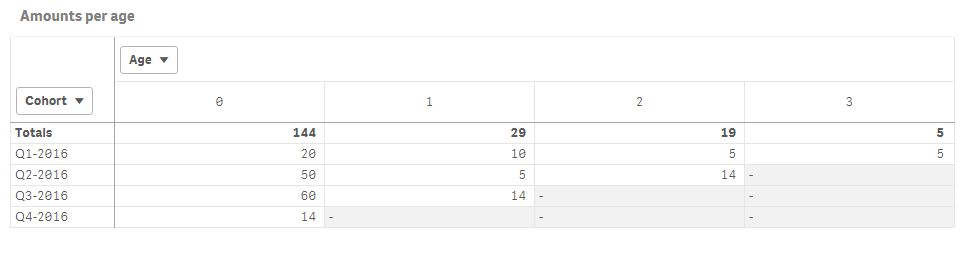
All amounts and totals are displayed as you expected.
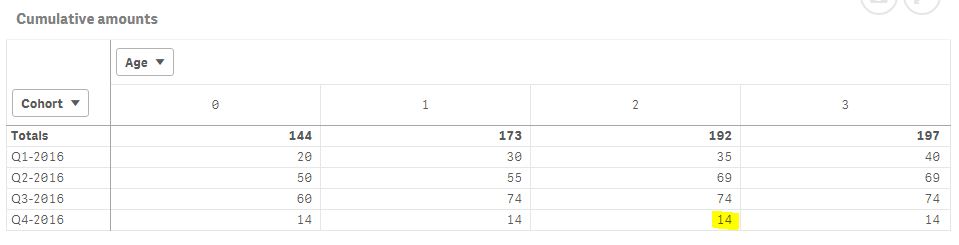
The problem begins when I create a pivot table with Cumulative sum of amounts as expression:
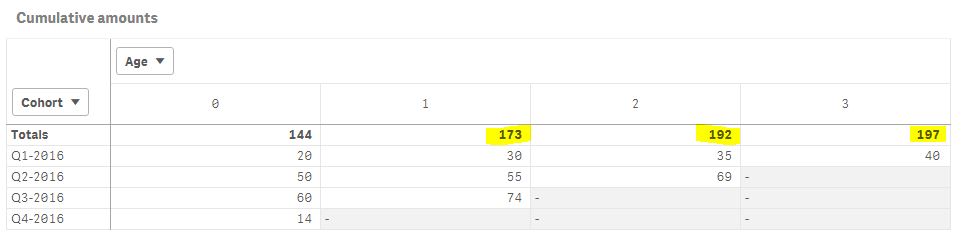
The highlighted Totals are incorrect..
I understand that Aggr function should be used to achieve the correct result, but couldn't figure out how exactly to use it.
I tried following the instruction here https://help.qlik.com/en-US/qlikview/12.0/Subsystems/Client/Content/ChartFunctions/NestedAggregation...
without any luck.
Any suggestion will be much appreciated.
Many thanks,
Anastasya
Accepted Solutions
- Mark as New
- Bookmark
- Subscribe
- Mute
- Subscribe to RSS Feed
- Permalink
- Report Inappropriate Content
Try this:
Sum(Aggr(RangeSum(Above(Sum(Amount),0,RowNo())), Cohort, Age))
- Mark as New
- Bookmark
- Subscribe
- Mute
- Subscribe to RSS Feed
- Permalink
- Report Inappropriate Content
you can try
if(rowno() = '0' , normal sum expression, cumulative sum expression)
or
if(dimensionality() = 0, normal sum expression, cumulative sum expression)
- Mark as New
- Bookmark
- Subscribe
- Mute
- Subscribe to RSS Feed
- Permalink
- Report Inappropriate Content
Use this code in your script and you will get your desired results in UI without changing any expression.
CohortForEx:
LOAD
Cohort,
"Age",
Amount,
Cohort&'|'&"Age" as ExistField //Created this field to use exists funtion
FROM [lib://Temp downloads/Cohort for ex.xlsx]
(ooxml, embedded labels, table is Sheet1);
Temp:
Load Distinct Cohort Resident CohortForEx;
Join
Load Distinct "Age",0 as Amount Resident CohortForEx;
// Took all possible combinations of Age and Cohort with zero amount
Concatenate(CohortForEx)
LOAD * Resident Temp where not Exists(ExistField,Cohort&'|'&"Age");
//Added only those combinations of Cohort and Age that does not exist in your data with Amount as 0
Drop Table Temp;
Drop Field ExistField;
- Mark as New
- Bookmark
- Subscribe
- Mute
- Subscribe to RSS Feed
- Permalink
- Report Inappropriate Content
Hi Shraddha,
Thank you for the quick response, however it doesn't yield the desired result.
It simply summarizes all amounts at a specific age, instead of summarizing the cumulative amounts.
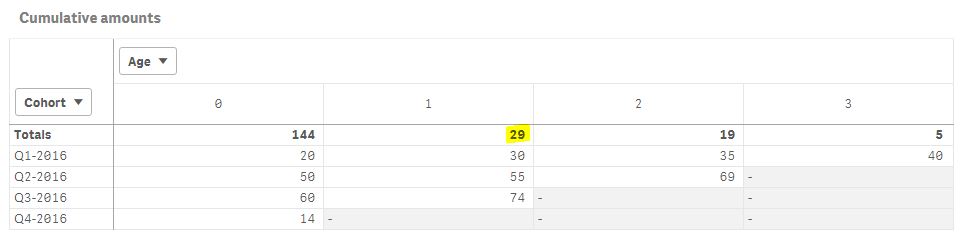
For example, at age 1, the total should be 30+55+74=159.
Any other ides?
Many thanks,
Anastasya
- Mark as New
- Bookmark
- Subscribe
- Mute
- Subscribe to RSS Feed
- Permalink
- Report Inappropriate Content
Try this:
Sum(Aggr(RangeSum(Above(Sum(Amount),0,RowNo())), Cohort, Age))
- Mark as New
- Bookmark
- Subscribe
- Mute
- Subscribe to RSS Feed
- Permalink
- Report Inappropriate Content
Hi Shubham,
Thank you for the quick response, however there are a few issues with this approach:
- It will significantly increase application load time as my real data set contains more than 700K...
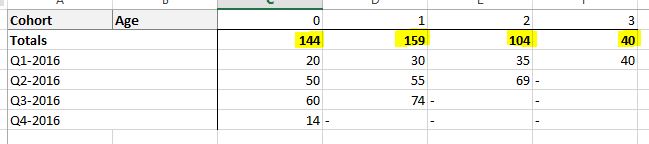
- Although technically it shows correct total amounts, it is incorrect in terms of Cohort analysis - the Q4-2016 group has not reached age 2 yet (for example, for customers who joined the company in Q4-2016 this is only the first Q=age 0 with the company) so I cannot show amount of 14 at age 2 for Q4-2016.
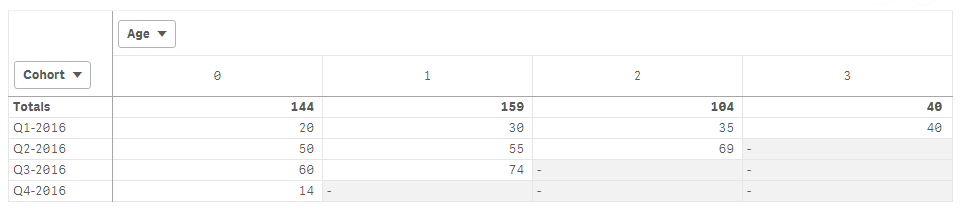
The desired output would look like this:
Any thoughts?
Thanks,
Anastasya
- Mark as New
- Bookmark
- Subscribe
- Mute
- Subscribe to RSS Feed
- Permalink
- Report Inappropriate Content
Thank you, Sunny!
You are a lifesaver! 
How did you know to use Above function and not Before?
I want to understand it for future work (I thought I did, but apparently not so much  )
)
- Mark as New
- Bookmark
- Subscribe
- Mute
- Subscribe to RSS Feed
- Permalink
- Report Inappropriate Content
Imagine Aggr() as an imaginary Straight table, where you cannot pivot a dimension like you do in pivot table. Since Before and After can only work with pivoted dimensions, Aggr() will never work with Before or After. So, you need to go back to Above or Below.
Does that make sense?
- Mark as New
- Bookmark
- Subscribe
- Mute
- Subscribe to RSS Feed
- Permalink
- Report Inappropriate Content
Yes 
Thank you so much!
- Mark as New
- Bookmark
- Subscribe
- Mute
- Subscribe to RSS Feed
- Permalink
- Report Inappropriate Content
how to change the total in a pivot table, I want to total header table without group, but the grout sum in the row. I dont know how to make.