Unlock a world of possibilities! Login now and discover the exclusive benefits awaiting you.
- Qlik Community
- :
- Forums
- :
- Analytics
- :
- App Development
- :
- Re: MoM and YTD Trend..
- Subscribe to RSS Feed
- Mark Topic as New
- Mark Topic as Read
- Float this Topic for Current User
- Bookmark
- Subscribe
- Mute
- Printer Friendly Page
- Mark as New
- Bookmark
- Subscribe
- Mute
- Subscribe to RSS Feed
- Permalink
- Report Inappropriate Content
MoM and YTD Trend..
Hi..
I want to show below expression in line chart...
sum({<Val_Date={">=$(vValStart)<=$(vValEnd)"}>}if(vCalCurrentDate< Val_Date,[Net Tractor Revenue (Domestic)]))
/
sum( {<Link_Date={">=$(vCalMinDate)<=$(vCalCurrentDate)"}>} [Net Tractor Revenue (Domestic)])
Please help me with this issue.
Regards,
Kavita
- « Previous Replies
-
- 1
- 2
- Next Replies »
- Mark as New
- Bookmark
- Subscribe
- Mute
- Subscribe to RSS Feed
- Permalink
- Report Inappropriate Content
Have you given it a shot at your end? I don't understand your data, I will need you to give me a kick start here....
- Mark as New
- Bookmark
- Subscribe
- Mute
- Subscribe to RSS Feed
- Permalink
- Report Inappropriate Content
Yess...
- Mark as New
- Bookmark
- Subscribe
- Mute
- Subscribe to RSS Feed
- Permalink
- Report Inappropriate Content
I have tried the below expression for the denominator part..
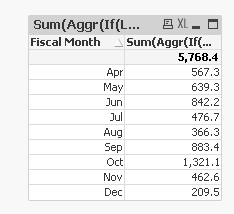
Sum(Aggr(If(Link_Date >= max([Quarter Start]) and Link_Date <= Max([Quarter End]), Sum([Net Tractor Revenue (Domestic)])), Link_Date, [Fiscal Month]))
But its summing up the data...
Regards,
Kavita
- Mark as New
- Bookmark
- Subscribe
- Mute
- Subscribe to RSS Feed
- Permalink
- Report Inappropriate Content
Do you know what are the numbers you will be seeing?
- Mark as New
- Bookmark
- Subscribe
- Mute
- Subscribe to RSS Feed
- Permalink
- Report Inappropriate Content
Below are the values:
For QTD: if i select Jun then it should show Apr, May and June..in Trend
For YTD: If i select Jul then it should show Apr to Jul
| Apr | 567.3 |
| May | 639.3 |
| Jun | 842.2 |
| Jul | 476.7 |
| Aug | 366.3 |
| Sep | 883.4 |
| Oct | 1,321.1 |
| Nov | 462.6 |
| Dec | 209.5 |
Regards,
Kavita
- Mark as New
- Bookmark
- Subscribe
- Mute
- Subscribe to RSS Feed
- Permalink
- Report Inappropriate Content
Wait, these are just denominator numbers? What exactly are you looking to show now? percentage or just the denominator? You have had me completely confused now
We already had this, what do you want from this now? You need two expressions, one for QTD and one for YTD?
- Mark as New
- Bookmark
- Subscribe
- Mute
- Subscribe to RSS Feed
- Permalink
- Report Inappropriate Content
MoM trend was successfully done..
Same i Want for Qtd and YTD...
So for testing i was using oly denominator...for Qtd and YTD..
I want that MoM trend values in QTD and YTD..
- « Previous Replies
-
- 1
- 2
- Next Replies »