Unlock a world of possibilities! Login now and discover the exclusive benefits awaiting you.
- Qlik Community
- :
- Forums
- :
- Analytics
- :
- New to Qlik Analytics
- :
- Re: Need help with Visualizations!!
- Subscribe to RSS Feed
- Mark Topic as New
- Mark Topic as Read
- Float this Topic for Current User
- Bookmark
- Subscribe
- Mute
- Printer Friendly Page
- Mark as New
- Bookmark
- Subscribe
- Mute
- Subscribe to RSS Feed
- Permalink
- Report Inappropriate Content
Need help with Visualizations!!
I am working on a retail dataset with sales and units data of different products spread across different categories for two consecutive years (Current year and previous year). How do I make a tab at the top with drop down values: 'Units" & 'Sales' so that when I select units, all the corresponding graphs' data show data related to Units and similarly when I select sales, the graphs data change to sales. Please help. Need to work on this urgently. Thanks in advance.
- Mark as New
- Bookmark
- Subscribe
- Mute
- Subscribe to RSS Feed
- Permalink
- Report Inappropriate Content
Could you tell me if this is a question for Qlik Sense or QlikView?
Based on your answer I will move it to the correct forum.
Thank you.
Onno
Community Team member
- Mark as New
- Bookmark
- Subscribe
- Mute
- Subscribe to RSS Feed
- Permalink
- Report Inappropriate Content
It's related to Qlik Sense.
Thank you.
- Mark as New
- Bookmark
- Subscribe
- Mute
- Subscribe to RSS Feed
- Permalink
- Report Inappropriate Content
for dropdown list box,
Try it
-use pivot table
-add dimension (Unit)
-Go to presentation Tab, check Dropdown Select
-Goto Caption Tab, uncheck Show Caption.
OR
Use Search Object, Go to properties, then in General Tab check Selected Fields, select field here e.g. Units in your case.
- Mark as New
- Bookmark
- Subscribe
- Mute
- Subscribe to RSS Feed
- Permalink
- Report Inappropriate Content
Hi,
Please see the sample attached.
- Dropdown has changed properties (Predefined Values)
- Straight table > Expression tab > Conditional (Show & hide based on drop down selection)
Hope it helps!
- Mark as New
- Bookmark
- Subscribe
- Mute
- Subscribe to RSS Feed
- Permalink
- Report Inappropriate Content
Okay; thank you.
Topic moved from "New to QlikView" to "New to Qlik Sense".
- Mark as New
- Bookmark
- Subscribe
- Mute
- Subscribe to RSS Feed
- Permalink
- Report Inappropriate Content
Hi Shaila. Thanks for your response. But I think you solution pertains to Qlikview. I am working on Qliksense.
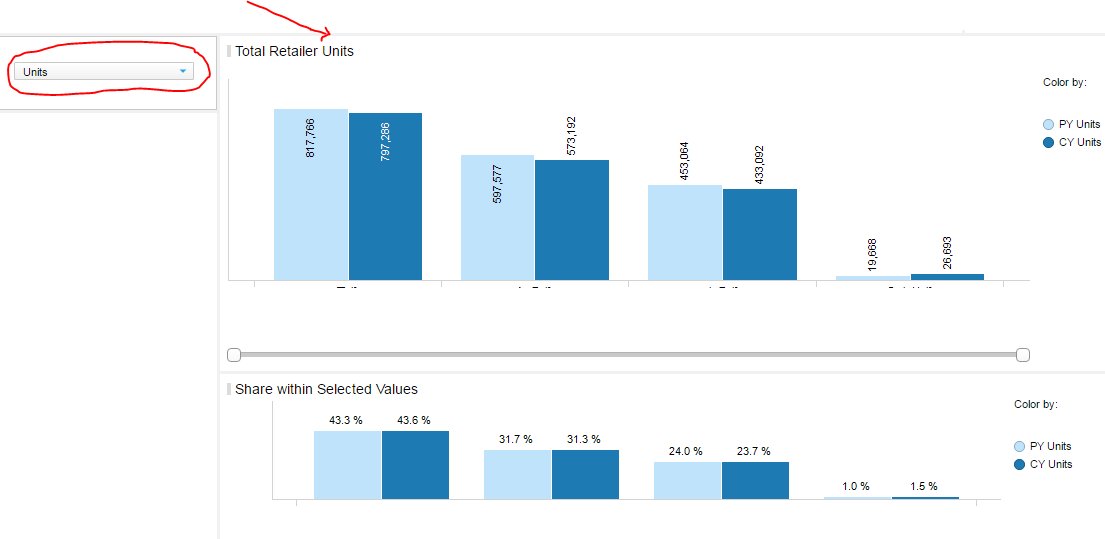
Please see the image below. I need a drop down menu with Units and Sales. So that when I select units, the graph changes to 'Total Retailer Units' and 'Share within Selected Values'. Similarly when I select sales, the graph changes to 'Total Retailer Sales' and 'Share within Selected Values'.
- Mark as New
- Bookmark
- Subscribe
- Mute
- Subscribe to RSS Feed
- Permalink
- Report Inappropriate Content
Hi,
Thanks for your response. But I think your solution pertains to Qlikview. I am working on Qliksense.
Please see the image below. I need a drop down menu with Units and Sales. So that when I select units, the graph changes to 'Total Retailer Units' and 'Share within Selected Values'. Similarly when I select sales, the graph changes to 'Total Retailer Sales' and 'Share within Selected Values'.

- Mark as New
- Bookmark
- Subscribe
- Mute
- Subscribe to RSS Feed
- Permalink
- Report Inappropriate Content
Qlik....Sense.....