Unlock a world of possibilities! Login now and discover the exclusive benefits awaiting you.
- Qlik Community
- :
- Forums
- :
- Analytics
- :
- New to Qlik Analytics
- :
- Re: How to compare records
- Subscribe to RSS Feed
- Mark Topic as New
- Mark Topic as Read
- Float this Topic for Current User
- Bookmark
- Subscribe
- Mute
- Printer Friendly Page
- Mark as New
- Bookmark
- Subscribe
- Mute
- Subscribe to RSS Feed
- Permalink
- Report Inappropriate Content
How to compare records
Hi,
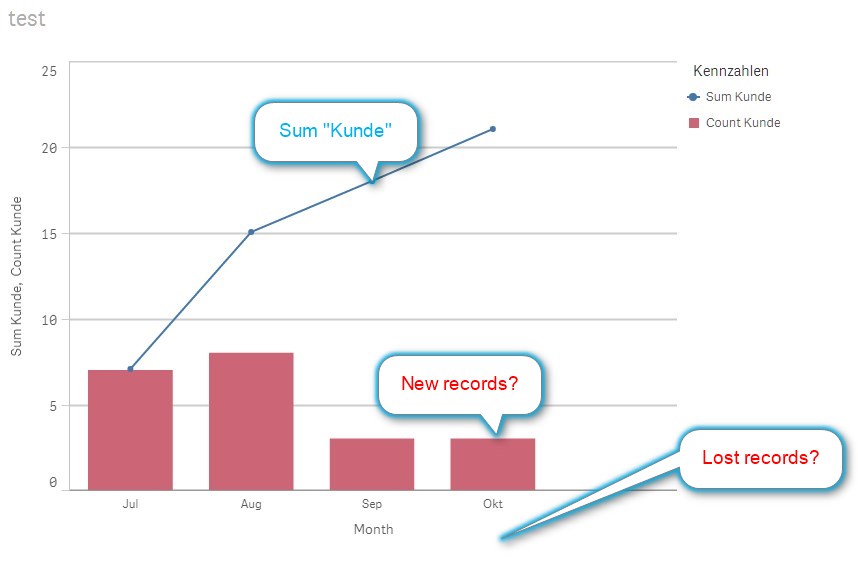
i want to show in a combi chart the
- Sum of "Kunde" (Customer) per month
- Each new record per month
- Each lost record per month
Example:
Each new record per month:
Each record wich have the current date of the month and is not existing the month before
In Aug are 4 new records
Each lost record per month:
Each record existing the month before, but not in the current month
In Aug are 3 lost records
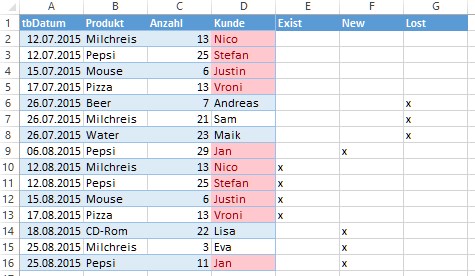
4 records already exist. The sum in Aug is 8.
This table is only for help to understand new, lost and exist, i use a table wich has only the columns from a to d.
How can i compare the data to show the number of new and lost records per month?
regards,
sam
- Mark as New
- Bookmark
- Subscribe
- Mute
- Subscribe to RSS Feed
- Permalink
- Report Inappropriate Content
may be like this
Month(Date#(Day, 'MM/DD/YYYY')) as Month
- Sum of "Kunde" (Customer) per month
aggr(count (kunde),Month) //Where Month derived from your tbDatum.
2. Each new record per month
aggr( count ( { < new={"x"} >}Kunde),Month) //Where Month derived from your tbDatum.
3. Each lost record per month
aggr( count ( { < Lost={"x"} >}Kunde),Month) //Where Month derived from your tbDatum.
- Mark as New
- Bookmark
- Subscribe
- Mute
- Subscribe to RSS Feed
- Permalink
- Report Inappropriate Content
Hi, thanks for your help.
This table is only for help to understand new, lost and exist, i use a table wich has only the columns from a to d.
I use this table:
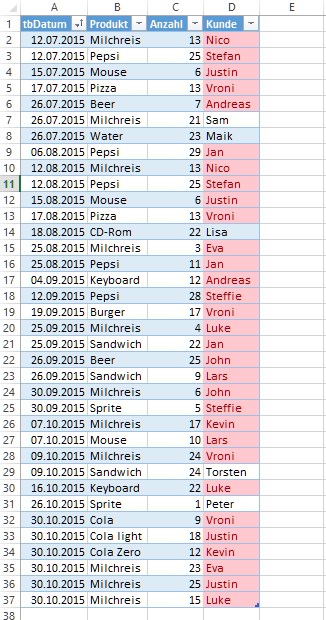
I search for a solution to work only with this table.
regards,
sam