Unlock a world of possibilities! Login now and discover the exclusive benefits awaiting you.
- Qlik Community
- :
- All Forums
- :
- QlikView App Dev
- :
- Re: Can I add row number to aggregate function in ...
- Subscribe to RSS Feed
- Mark Topic as New
- Mark Topic as Read
- Float this Topic for Current User
- Bookmark
- Subscribe
- Mute
- Printer Friendly Page
- Mark as New
- Bookmark
- Subscribe
- Mute
- Subscribe to RSS Feed
- Permalink
- Report Inappropriate Content
Can I add row number to aggregate function in charts - non-standard quartile request
Hi all,
I will try and keep this as simple as possible:
Aim:
1) The client wants us to break the data into quartiles, BUT based on literally sorting all Staff IDs ascending by salary and then dividing into 4 equal sections (e.g if 100 employees then split into 4 groups of 25). Ignoring the median.
2) It should then be possible to run quartiles on different selections as per filters (e.g see quartiles for different pay elements as well as gross pay)
The Problem:
1) We CANNOT use Fractile() as there are e.g 40 employees all on the same pay and so the Fractile function would group all of them into one bucket, thus making the 4 groups uneven. The client wants the buckets completely even even if it means splitting the same pay value into 2 or more quartiles.
2) We CANNOT do it in the loading script (or as far as we've tried) as I am unable to make the script flexible enough to be able to filter on various pay elements.
What we've tried/Hoping to achieve:
1) Have tried to look at using variables in the load script as well as fractile in front end but as per 'The Problem' above none of these worked
2) Considered using Rank within the aggr() function but again it pulls the same problem as Fractile() since all matching values will be given the same rank rather than unique numbers as per RowNo()
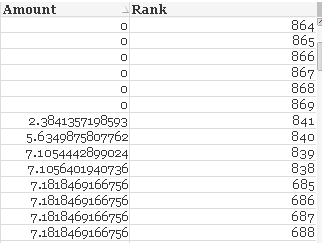
3) Have also tried num(Rank(Amount, 4)) which was given as a solution to another question here but it is producing some funny outputs when I tried to make a test table (e.g all numbers a unique but they are certainly not in asc/desc order) NOTE: Amount is sorted ASC.
Theoretical solution:
1) What I think I need to do is in the table chart - create an aggregate table (flexible enough to change based on filters) and then apply RowNo() to that aggregated table and use something along the lines of:
=if(RowNo() <= (count(distinct([Staff Number])/4), 'Quartile A',
if(RowNo() <= ((count(distinct([Staff Number])/4) *2), 'Quartile B'...and so on and so forth for the 4 group (and of course within the aggr() function)
2) If anyone knows how to fix the Rank() problem above that may also provide the solution we need
Thanks in advance!!!
Accepted Solutions
- Mark as New
- Bookmark
- Subscribe
- Mute
- Subscribe to RSS Feed
- Permalink
- Report Inappropriate Content
May be this:
='Pay band '&if(
aggr(Rank(sum(Amount), 4),[StaffNo]) <= (count(TOTAL distinct(StaffNo))/4), 'A (Lowest)',
if(aggr(Rank(sum(Amount), 4),[StaffNo]) <= ((count(TOTAL distinct(StaffNo))/4)*2), 'B',
if(aggr(Rank(sum(Amount), 4),[StaffNo]) <= ((count(TOTAL distinct(StaffNo))/4)*3),'C', 'D (Highest)'))
)
- Mark as New
- Bookmark
- Subscribe
- Mute
- Subscribe to RSS Feed
- Permalink
- Report Inappropriate Content
Would you be able to share a sample to look at the issue?
- Mark as New
- Bookmark
- Subscribe
- Mute
- Subscribe to RSS Feed
- Permalink
- Report Inappropriate Content
Thanks for the reply,
After some further investigation I have realised that the Rank function IS working - for some reason, where there are multiple entries with the same value it reverses the rank numbers so everything looks out of sync (but as they are the same values anyway it makes no difference how they are ranked) (see all values at 0.00 and 36.68 in attached)
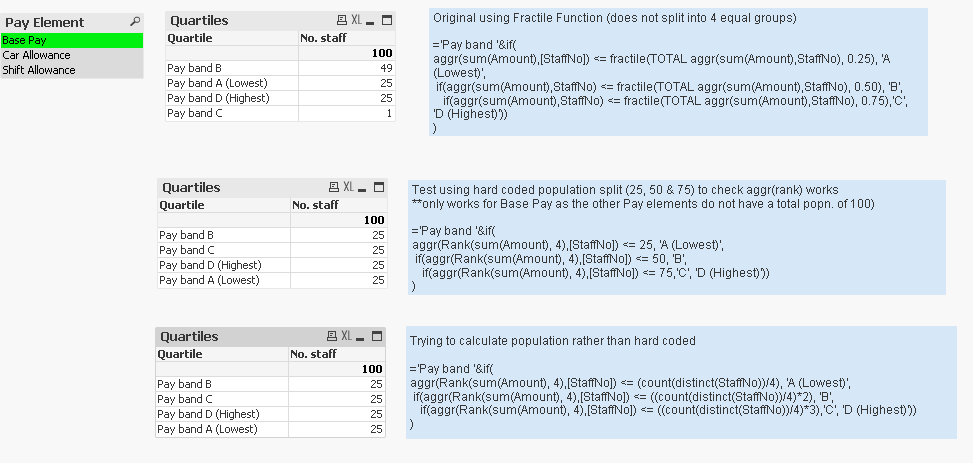
Onto the overall issue of using this to split the population into 4 equal groups. I have attached my sample project, filtered on Base Pay for now. There are 3 key attempts ('Quartiles' tables):
1) Using Qlik's Fractile function - you can see that the popuation of 100 is not split into 4 groups of 25 as desired
2) My first test, using the rank function within aggregate and hardcoding the quartile populations into blocks of 25 to check the first aggr(rank()) works
3) Trying to calculate the population which needs to be variable depending on filter/new client data, using the calculation below:
='Pay band '&if(
aggr(Rank(sum(Amount), 4),[StaffNo]) <= (count(distinct(StaffNo))/4), 'A (Lowest)',
if(aggr(Rank(sum(Amount), 4),[StaffNo]) <= ((count(distinct(StaffNo))/4)*2), 'B',
if(aggr(Rank(sum(Amount), 4),[StaffNo]) <= ((count(distinct(StaffNo))/4)*3),'C', 'D (Highest)'))
)
I fell like I must be missing something very obvious!
Thanks!
- Mark as New
- Bookmark
- Subscribe
- Mute
- Subscribe to RSS Feed
- Permalink
- Report Inappropriate Content
May be this:
='Pay band '&if(
aggr(Rank(sum(Amount), 4),[StaffNo]) <= (count(TOTAL distinct(StaffNo))/4), 'A (Lowest)',
if(aggr(Rank(sum(Amount), 4),[StaffNo]) <= ((count(TOTAL distinct(StaffNo))/4)*2), 'B',
if(aggr(Rank(sum(Amount), 4),[StaffNo]) <= ((count(TOTAL distinct(StaffNo))/4)*3),'C', 'D (Highest)'))
)
- Mark as New
- Bookmark
- Subscribe
- Mute
- Subscribe to RSS Feed
- Permalink
- Report Inappropriate Content
Thanks, the TOTAL works.
Have marked appropriately, thanks again 