Unlock a world of possibilities! Login now and discover the exclusive benefits awaiting you.
- Qlik Community
- :
- Forums
- :
- Analytics
- :
- New to Qlik Analytics
- :
- Re: N Top with two Dimensions
- Subscribe to RSS Feed
- Mark Topic as New
- Mark Topic as Read
- Float this Topic for Current User
- Bookmark
- Subscribe
- Mute
- Printer Friendly Page
- Mark as New
- Bookmark
- Subscribe
- Mute
- Subscribe to RSS Feed
- Permalink
- Report Inappropriate Content
N Top with two Dimensions
Hello everybody,
I need your help with Qlik Sense please. I would like to create Top 5 with two dimensions.
I found this one on the Community:
Sum({<Bezeichung = {"=Rank(Sum(Werte))<=10"}>} Werte)
But that works just with one dimension (Bezeichnung). I have the dimensions (Datum & Bezeichung).
Does somebody has any ideas to solve my problem?
Thank you very much for your help!
Christian
- « Previous Replies
-
- 1
- 2
- Next Replies »
Accepted Solutions
- Mark as New
- Bookmark
- Subscribe
- Mute
- Subscribe to RSS Feed
- Permalink
- Report Inappropriate Content
You can try like this
If(Rank(Sum(Werte)) < 10, Sum(Werte))
or
If(Rank(TOTAL Sum(Werte)) < 10, Sum(Werte))
- Mark as New
- Bookmark
- Subscribe
- Mute
- Subscribe to RSS Feed
- Permalink
- Report Inappropriate Content
You can try like this
If(Rank(Sum(Werte)) < 10, Sum(Werte))
or
If(Rank(TOTAL Sum(Werte)) < 10, Sum(Werte))
- Mark as New
- Bookmark
- Subscribe
- Mute
- Subscribe to RSS Feed
- Permalink
- Report Inappropriate Content
Hi Sunny,
thank you for your qiuck answer.
Your solution almost works. My first dimension, Datum (Date), shows a cumulated value of the balance sheet, raw materials. The second dimension, Bezeichnung, shows every single position of the cumulated value of the balance sheet. With your scripting on the second dimension, I can see top 10 single positions with the right value. But on the first dimension (Datum) I just can see 10 positions of the cumulated value of the balance sheet. I need to see all values from December 2015 to December 2016. I hope I explained my problem understandable enough.
Do you have an idea how to solve the problem?
Thanks for your help1
Christian
- Mark as New
- Bookmark
- Subscribe
- Mute
- Subscribe to RSS Feed
- Permalink
- Report Inappropriate Content
I am not sure I understand what you are looking to get for Datum dimension. Would you be able to share a sample to show your issue?
- Mark as New
- Bookmark
- Subscribe
- Mute
- Subscribe to RSS Feed
- Permalink
- Report Inappropriate Content
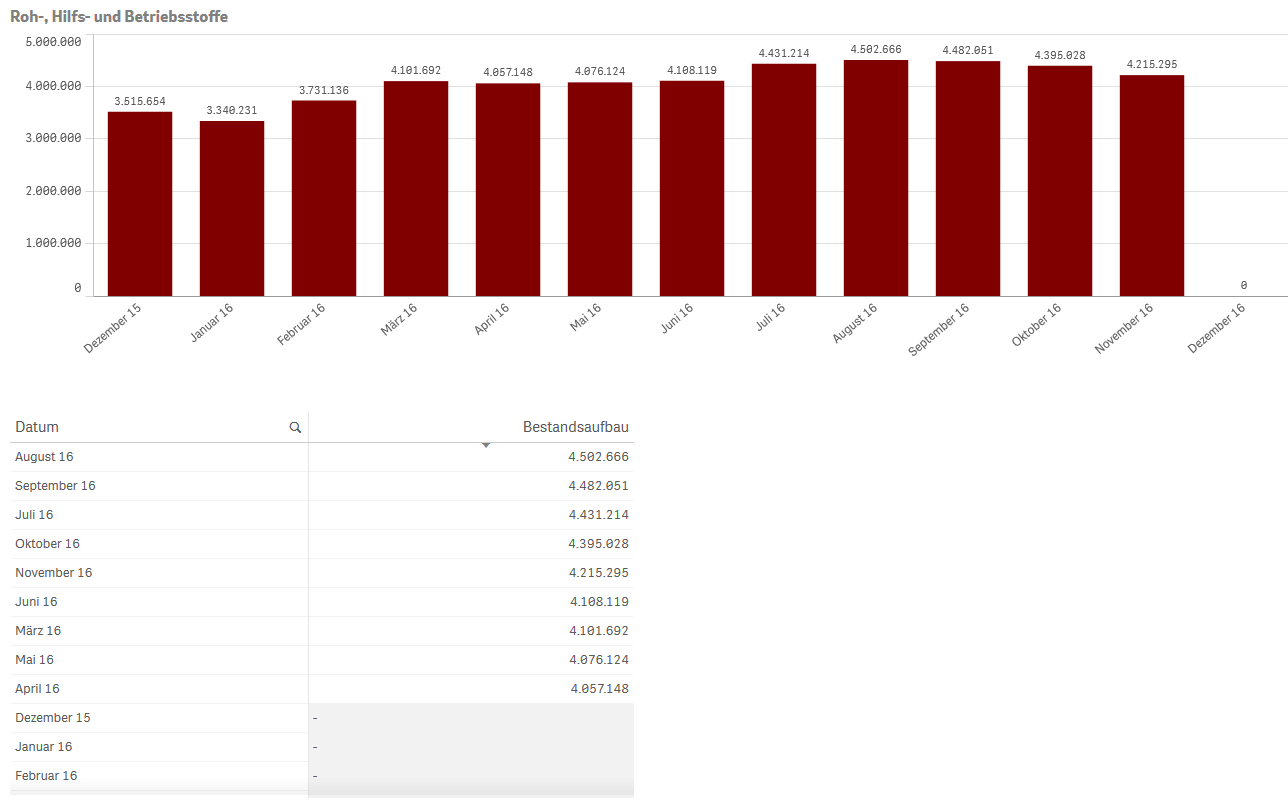
I hope my screenshots help to understand my issue.
The screenshot shows the values based on the first Dimension (Datum). On the Table below I just can´t see every value like in the bar chart above. I would like to see every month with the value on the chart and the table. In the table I used your scripting.
This screenshot shows one month which I chose to see the details of the month. Here you can see the second dimension (Bezeichnung). Your script works the way it should.
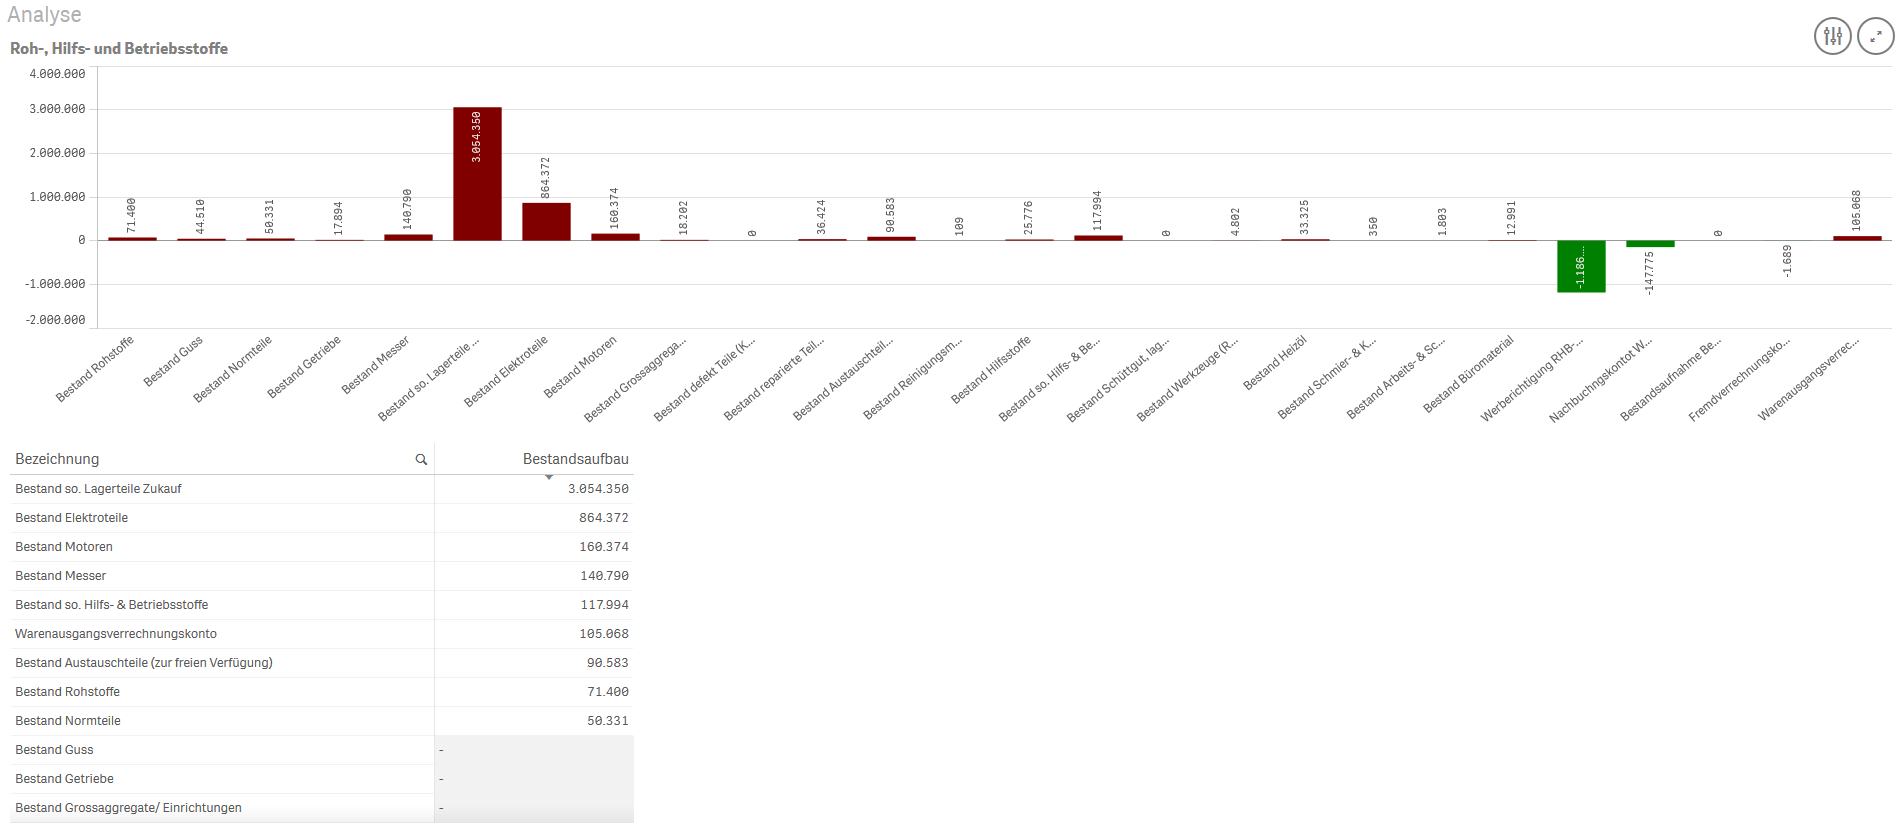
I really hope my problem now is unterstandable.
Christian
- Mark as New
- Bookmark
- Subscribe
- Mute
- Subscribe to RSS Feed
- Permalink
- Report Inappropriate Content
Not sure which of the two expression worked, but may be this:
Sum(Aggr(If(Rank(Sum(Werte)) < 10, Sum(Werte)), Datum, Bezeichung))
or
Sum(Aggr(If(Rank(TOTAL Sum(Werte)) < 10, Sum(Werte)), Datum, Bezeichung))
- Mark as New
- Bookmark
- Subscribe
- Mute
- Subscribe to RSS Feed
- Permalink
- Report Inappropriate Content
The first one shows every month, that works. But it doesn´t show the correct values.
E.g.:
Dezember should have a value of 3.515 T€, but with the expression the value rises to 4.655 T€. Another problem is if I change from 10 to 5 in the expresion the value of December decrease to 4.219 T€.
Why does the TOP N position influence the value of December?
Thanks for your help, without your help I would have a big problem!
Christian
- Mark as New
- Bookmark
- Subscribe
- Mute
- Subscribe to RSS Feed
- Permalink
- Report Inappropriate Content
I think I am not completely understanding what you have + I am just guessing on what might work and not able to play around with it. Do you think you can share a sample qvf file for me to look at?
- Mark as New
- Bookmark
- Subscribe
- Mute
- Subscribe to RSS Feed
- Permalink
- Report Inappropriate Content
The sample you asked for. I hope it works.
- Mark as New
- Bookmark
- Subscribe
- Mute
- Subscribe to RSS Feed
- Permalink
- Report Inappropriate Content
Can you check if the attached is what you want?
- « Previous Replies
-
- 1
- 2
- Next Replies »