Unlock a world of possibilities! Login now and discover the exclusive benefits awaiting you.
- Qlik Community
- :
- All Forums
- :
- QlikView App Dev
- :
- Re: YTD percentage
- Subscribe to RSS Feed
- Mark Topic as New
- Mark Topic as Read
- Float this Topic for Current User
- Bookmark
- Subscribe
- Mute
- Printer Friendly Page
- Mark as New
- Bookmark
- Subscribe
- Mute
- Subscribe to RSS Feed
- Permalink
- Report Inappropriate Content
YTD percentage
Hi All,
I am trying to calculate a year-to-date percentage, based on a number of value fields in my QV-model.
I have 5 fields in my fact table T1WeightedTime through T5WeightedTime. In the below screenshot, you can see the export from my QlikView chart in the range A1:G5. The YTD values of T1 through T5 in B3:F5 are correct, so I would expect that, If I reuse these columns in my final column (col G in the below Excel sheet), the YTD percentage would be calculated correctly. However, that doesn't seem to be true: I have manually calculated the correct values in Excel in column H. For months 2 and 3 (and further if I'd show them as well, I suspect), the QlikView result does not match the manual result in Excel.
I have checked the Full Accumulation option for T1 through T5, but not for my percentage column (this would give 194.66 % for month 2 and 293.89 % for month 3)
I have no clue on how to resolve this issue.
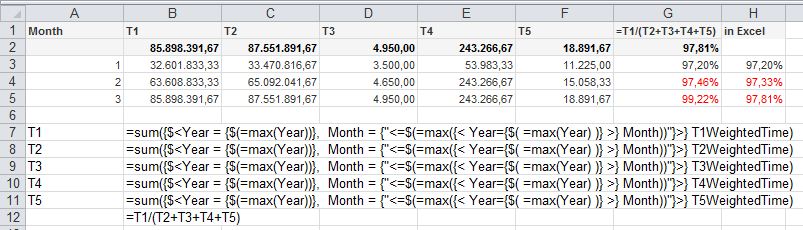
FYI; I have included the expressions for T1 through T5, and for the final column for the percentage.
Any thoughts?
Thanks and regards,
Fréderic
Accepted Solutions
- Mark as New
- Bookmark
- Subscribe
- Mute
- Subscribe to RSS Feed
- Permalink
- Report Inappropriate Content
Seem to have found the solution: one should use rangesums:
=rangesum( sum({$<Year = {$(=max(Year))}, Month = {"<=$(=max({< Year={$( =max(Year) )} >} Month))"}>} T1WeightedTime) , Above(sum({$<Year = {$(=max(Year))}, Month = {"<=$(=max({< Year={$( =max(Year) )} >} Month))"}>} T1WeightedTime), 1, Month))
/
(
rangesum( sum({$<Year = {$(=max(Year))}, Month = {"<=$(=max({< Year={$( =max(Year) )} >} Month))"}>} T2WeightedTime) , Above(sum({$<Year = {$(=max(Year))}, Month = {"<=$(=max({< Year={$( =max(Year) )} >} Month))"}>} T2WeightedTime), 1, Month)) -
rangesum( sum({$<Year = {$(=max(Year))}, Month = {"<=$(=max({< Year={$( =max(Year) )} >} Month))"}>} T3WeightedTime) , Above(sum({$<Year = {$(=max(Year))}, Month = {"<=$(=max({< Year={$( =max(Year) )} >} Month))"}>} T3WeightedTime), 1, Month)) -
rangesum( sum({$<Year = {$(=max(Year))}, Month = {"<=$(=max({< Year={$( =max(Year) )} >} Month))"}>} T4WeightedTime) , Above(sum({$<Year = {$(=max(Year))}, Month = {"<=$(=max({< Year={$( =max(Year) )} >} Month))"}>} T4WeightedTime), 1, Month)) -
rangesum( sum({$<Year = {$(=max(Year))}, Month = {"<=$(=max({< Year={$( =max(Year) )} >} Month))"}>} T5WeightedTime) , Above(sum({$<Year = {$(=max(Year))}, Month = {"<=$(=max({< Year={$( =max(Year) )} >} Month))"}>} T5WeightedTime), 1, Month))
)
- Mark as New
- Bookmark
- Subscribe
- Mute
- Subscribe to RSS Feed
- Permalink
- Report Inappropriate Content
Hi,
Can you Please upload the Qvw for more clearification.
Regards,
Kaushik Solanki
- Mark as New
- Bookmark
- Subscribe
- Mute
- Subscribe to RSS Feed
- Permalink
- Report Inappropriate Content
Qvw, as requested.
F.
- Mark as New
- Bookmark
- Subscribe
- Mute
- Subscribe to RSS Feed
- Permalink
- Report Inappropriate Content
Hi,
There is no Year field in the QVW you uploaded.
Please give a qvw with full data
Regards,
Kaushik Solanki
- Mark as New
- Bookmark
- Subscribe
- Mute
- Subscribe to RSS Feed
- Permalink
- Report Inappropriate Content
Sorry ‘bout that. New file in attachment contains data for 2010 & 2011 (2 full years).
F.
- Mark as New
- Bookmark
- Subscribe
- Mute
- Subscribe to RSS Feed
- Permalink
- Report Inappropriate Content
Hi Fred,
Please use this formula in the expression
T1 = sum({$<Year = {$(=max(Year))}, Month = {$(=max(Month))}>} T1WeightedTime)
T2 = sum({$<Year = {$(=max(Year))}, Month = {$(=max(Month))}>} T2WeightedTime)
and so on and use these expressions to put a percentage as well. Unfortunately I am not able to upload the modified qvw file
Regards,
Raghav
- Mark as New
- Bookmark
- Subscribe
- Mute
- Subscribe to RSS Feed
- Permalink
- Report Inappropriate Content
Find attached the file
- Mark as New
- Bookmark
- Subscribe
- Mute
- Subscribe to RSS Feed
- Permalink
- Report Inappropriate Content
Hi Raghav,
Thanks for your contribution, however, I need to work with the cumulated Tx amounts, in order to obtain a cumulative percentage on a per month basis (see the below Tx amounts for 2011). Hence my Month expression will be Month = {"<=$(=max({< Year={$( =max(Year) )} >} Month))"}
Also, I would like to view all of the months of one year simultaneously, since I will be plotting this in a graph later on.
Thanks,
F.
- Mark as New
- Bookmark
- Subscribe
- Mute
- Subscribe to RSS Feed
- Permalink
- Report Inappropriate Content
Anyone any thoughts?
F.
- Mark as New
- Bookmark
- Subscribe
- Mute
- Subscribe to RSS Feed
- Permalink
- Report Inappropriate Content
Seem to have found the solution: one should use rangesums:
=rangesum( sum({$<Year = {$(=max(Year))}, Month = {"<=$(=max({< Year={$( =max(Year) )} >} Month))"}>} T1WeightedTime) , Above(sum({$<Year = {$(=max(Year))}, Month = {"<=$(=max({< Year={$( =max(Year) )} >} Month))"}>} T1WeightedTime), 1, Month))
/
(
rangesum( sum({$<Year = {$(=max(Year))}, Month = {"<=$(=max({< Year={$( =max(Year) )} >} Month))"}>} T2WeightedTime) , Above(sum({$<Year = {$(=max(Year))}, Month = {"<=$(=max({< Year={$( =max(Year) )} >} Month))"}>} T2WeightedTime), 1, Month)) -
rangesum( sum({$<Year = {$(=max(Year))}, Month = {"<=$(=max({< Year={$( =max(Year) )} >} Month))"}>} T3WeightedTime) , Above(sum({$<Year = {$(=max(Year))}, Month = {"<=$(=max({< Year={$( =max(Year) )} >} Month))"}>} T3WeightedTime), 1, Month)) -
rangesum( sum({$<Year = {$(=max(Year))}, Month = {"<=$(=max({< Year={$( =max(Year) )} >} Month))"}>} T4WeightedTime) , Above(sum({$<Year = {$(=max(Year))}, Month = {"<=$(=max({< Year={$( =max(Year) )} >} Month))"}>} T4WeightedTime), 1, Month)) -
rangesum( sum({$<Year = {$(=max(Year))}, Month = {"<=$(=max({< Year={$( =max(Year) )} >} Month))"}>} T5WeightedTime) , Above(sum({$<Year = {$(=max(Year))}, Month = {"<=$(=max({< Year={$( =max(Year) )} >} Month))"}>} T5WeightedTime), 1, Month))
)