Unlock a world of possibilities! Login now and discover the exclusive benefits awaiting you.
- Qlik Community
- :
- Forums
- :
- Analytics
- :
- New to Qlik Analytics
- :
- Re: What is a suitable Set Analysis expression for...
- Subscribe to RSS Feed
- Mark Topic as New
- Mark Topic as Read
- Float this Topic for Current User
- Bookmark
- Subscribe
- Mute
- Printer Friendly Page
- Mark as New
- Bookmark
- Subscribe
- Mute
- Subscribe to RSS Feed
- Permalink
- Report Inappropriate Content
What is a suitable Set Analysis expression for distinct counts based on condition/groupings
Hi,
I'm trying to create a suitable expression using the Qlik Sense KPI extension that returns a distinct count of Members who appear in both Divisions (there are currently only 2).
An extract of my 5,000 row dataset looks like this:
| Division | Area | Member |
| Region East | Grafton | George |
| Region East | Newcastle | Jack |
| Region East | Byron Bay | Joe |
| Region West | Bullamanka | Katrina |
| Region West | Broken Hill | Joe |
| Region West | Parkes | Bluey |
| Region West | Albury | Beachball |
| Region West | Wentworth | Costello |
| Region West | Wilcannia | Abbott |
| Region West | Dubbo | Jack |
| Region West | Goulburn | Amos |
| Region West | Cobar | Joe |
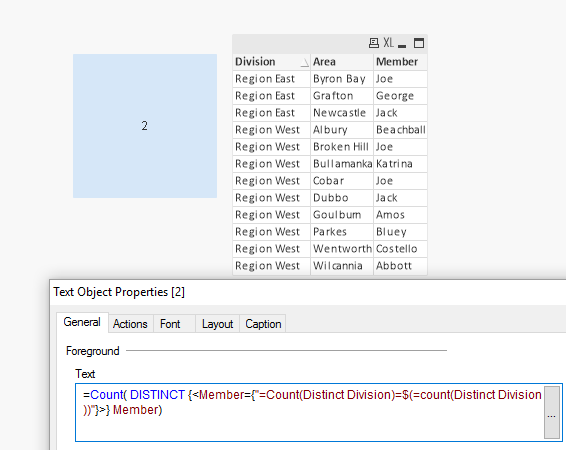
Looking at this dataset, based on my requirements, the expression should return the correct answer of 2 (Jack and Joe - as they at least appear once in both Region East and Region West)
I'm stuck at the moment and started with this expression when maybe I should use set analysis:
aggr (count(Member), Division, Member ) )
Any help will be greatly appreciated.
Thanks.
- « Previous Replies
-
- 1
- 2
- Next Replies »
Accepted Solutions
- Mark as New
- Bookmark
- Subscribe
- Mute
- Subscribe to RSS Feed
- Permalink
- Report Inappropriate Content
>>thank you for your reply. Unfortunately it returns the total number of unique members across the whole dataset (623)
The expression should read:
=Sum(Aggr(If(Count(DISTINCT Division & Region) >= 2, 1, 0), Member))
(sum, not count - count will return everything, but sum should work)
- Mark as New
- Bookmark
- Subscribe
- Mute
- Subscribe to RSS Feed
- Permalink
- Report Inappropriate Content
This is what you looking for ?

- Mark as New
- Bookmark
- Subscribe
- Mute
- Subscribe to RSS Feed
- Permalink
- Report Inappropriate Content
Try below expression:
Count( DISTINCT {<Member={"=Count(Distinct Division)=$(=count(Distinct Division))"}>} Member)
- Mark as New
- Bookmark
- Subscribe
- Mute
- Subscribe to RSS Feed
- Permalink
- Report Inappropriate Content
Hi Tresesco,
thank you for responding. Unfortunately it doesn't return a value.
ozzie
- Mark as New
- Bookmark
- Subscribe
- Mute
- Subscribe to RSS Feed
- Permalink
- Report Inappropriate Content
How about this?
Count(Aggr(If(Count(DISTINCT Division & Region) >= 2, 1, 0), Member))
Sum(Aggr(If(Count(DISTINCT Division & Region) >= 2, 1, 0), Member))
- Mark as New
- Bookmark
- Subscribe
- Mute
- Subscribe to RSS Feed
- Permalink
- Report Inappropriate Content
hi Jonathan,
thank you for your reply. Unfortunately it returns the total number of unique members across the whole dataset (623)
I will say this, both of you guys have given me some ideas to look at.
thanks.
- Mark as New
- Bookmark
- Subscribe
- Mute
- Subscribe to RSS Feed
- Permalink
- Report Inappropriate Content
Hello Ozzie,
To get the member count who are present two times define below expression for KPI:
Sum(aggr(if(COUNT(Member)>1,1,0),Member))
Hope this will solve your problem.
Thank you!
Rahul
- Mark as New
- Bookmark
- Subscribe
- Mute
- Subscribe to RSS Feed
- Permalink
- Report Inappropriate Content
Hi Rahul,
Yes, I agree, but I have many multiples of members across the 5,000 entries. Precisely, there are 623 unique members across the 5,000 records. Nearly all are in one or the other Division (Region East or Region West).
I know there are a few members that belong to multiple areas in both Divisions - these are the ones I'm trying to trap and produce a distinct count of those members so that we don't count them more than once.
Thanks for your help here 🙂
Ozzie
- Mark as New
- Bookmark
- Subscribe
- Mute
- Subscribe to RSS Feed
- Permalink
- Report Inappropriate Content
Did you try in a text box?
- Mark as New
- Bookmark
- Subscribe
- Mute
- Subscribe to RSS Feed
- Permalink
- Report Inappropriate Content
Based on the suggestion from Jonathan I could imagine that using a table-chart with:
Aggr(Count(DISTINCT Division & Member), Member)
as calculated dimension and:
count(Member)
as expression could be helpful.
- Marcus
- « Previous Replies
-
- 1
- 2
- Next Replies »