Unlock a world of possibilities! Login now and discover the exclusive benefits awaiting you.
- Qlik Community
- :
- Forums
- :
- Analytics
- :
- New to Qlik Analytics
- :
- Re: Qlik Sense Line chart calculation
- Subscribe to RSS Feed
- Mark Topic as New
- Mark Topic as Read
- Float this Topic for Current User
- Bookmark
- Subscribe
- Mute
- Printer Friendly Page
- Mark as New
- Bookmark
- Subscribe
- Mute
- Subscribe to RSS Feed
- Permalink
- Report Inappropriate Content
Qlik Sense Line chart calculation
Dear Experts,
I am trying to achieve a functionality in Qlik Sense Line chart's expression.
Attached excel have sample data which I am trying to achieve.
Little bit of explanation below :
I have data upto March 2016 at month level (Column D).
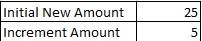
I want to calculate New Amount (Column E) based on Column I "Initial New Amount" and "Increment Amount".
I am able to calculate "Initial New Amount" and "Increment Amount" based on certain business rules but I am not able to figure out how I can calculate the "New Amount" for the missing months, formula to be used is ..
For first missing month is = "Initial New Amount"
Subsequent Missing Month = Previous Month New Amount + "Increment Amount"
Any help in this regard is highly appreciated.
Regards,
RG
Accepted Solutions
- Mark as New
- Bookmark
- Subscribe
- Mute
- Subscribe to RSS Feed
- Permalink
- Report Inappropriate Content
Hi Rahul.
If I have correctly understood the problem, a variant of the solution by "My sheet3" in the attached file qvf.
Added two variables (Test in M7) are used in the expression Chart.
Regards,
Andrey
- Mark as New
- Bookmark
- Subscribe
- Mute
- Subscribe to RSS Feed
- Permalink
- Report Inappropriate Content
Do I understand the problem?
There is a table
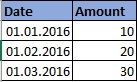
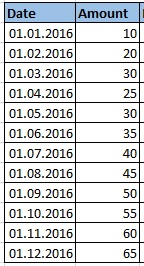
That needs to be downloaded in Qlik Sense. Further, we have
Must be extended to the form table
Correctly?
- Mark as New
- Bookmark
- Subscribe
- Mute
- Subscribe to RSS Feed
- Permalink
- Report Inappropriate Content
Hi Andrey,
Yes, but it is to be done at chart level not in script.
Regards,
RG
- Mark as New
- Bookmark
- Subscribe
- Mute
- Subscribe to RSS Feed
- Permalink
- Report Inappropriate Content
Hi Rahul!
On the chart level is necessary to create a synthetic dimension (by field "Date", the downloaded Date is not). Functions ValueList() and ValueLoop() as arguments accept only constants. It is not possible to create a dimension "date"calculated by.
As an option, exit out of this situation as follows. Likely the master calendar is loaded during download script. It is possible to include the field start of the month as a standard date. Example,
MonthStart(MakeDate(Year(Left([Period], 10)),Month(Left([Period], 10)))) as CalendarFistMonthDay
This allows the field "CalendarFistMonthDay" is the master calendar used as dimension in our diagram.
As an option, expression of the chart could look like this
If(CalendarFistMonthDay <= Max(DateS), Sum(Value), 25 + 5*(Month(CalendarFistMonthDay)-4))
An example can be found in the attached file.
Regards,
Andrey
- Mark as New
- Bookmark
- Subscribe
- Mute
- Subscribe to RSS Feed
- Permalink
- Report Inappropriate Content
Alternatively, if you have downloaded the date field, the line chart can be obtained by dimension
=MonthStart([%Date])
the expression
If(Only(MonthStart([%Date])) <= Max(DateS), Sum(Value), 25 + 5*(Month(Only(MonthStart([%Date])))-4))
The file as an attachment, Sheet2
- Mark as New
- Bookmark
- Subscribe
- Mute
- Subscribe to RSS Feed
- Permalink
- Report Inappropriate Content
Hi Andrey,
Thanks for taking time and looking into my question.
The solution you are suggesting helped me partially.
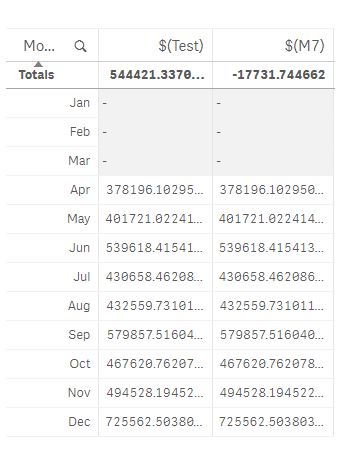
I am running into issue because I want to use $(Test) as base value and $(M7) as increment value but when I use these variables in chart or table they are giving different values based on Year Month as dimension.
But what I am trying to do is get $(Test) = 544421.33 assign it to April 01, 2016 then for rest of the months it should be 544421.33 + $(M7) where $(M7) = -17731.74.
Please refer to screenshot below.
Any suggestion to resolve this issue is highly appreciated.
Regards,
RG
- Mark as New
- Bookmark
- Subscribe
- Mute
- Subscribe to RSS Feed
- Permalink
- Report Inappropriate Content
Hi Rahul.
If I have correctly understood the problem, a variant of the solution by "My sheet3" in the attached file qvf.
Added two variables (Test in M7) are used in the expression Chart.
Regards,
Andrey
- Mark as New
- Bookmark
- Subscribe
- Mute
- Subscribe to RSS Feed
- Permalink
- Report Inappropriate Content
Hi Andrey,
Thank you so much for taking time to look into the issue.
Yes, the solution works absolutely as expected.
Thanks!
Regards,
RG