Unlock a world of possibilities! Login now and discover the exclusive benefits awaiting you.
- Qlik Community
- :
- All Forums
- :
- QlikView App Dev
- :
- Re: Aggr, Max and Sum
- Subscribe to RSS Feed
- Mark Topic as New
- Mark Topic as Read
- Float this Topic for Current User
- Bookmark
- Subscribe
- Mute
- Printer Friendly Page
- Mark as New
- Bookmark
- Subscribe
- Mute
- Subscribe to RSS Feed
- Permalink
- Report Inappropriate Content
Aggr, Max and Sum
Dear Qlik colleagues,
File attached is calculating the total time of sales order flow inside company I work for.
We have average time and total time. The second gets the worst case on each department (Logistics, Sales-Comercial and Financial). But we desire to get the longer Sales Order (Pedido) instead of longer on each department.
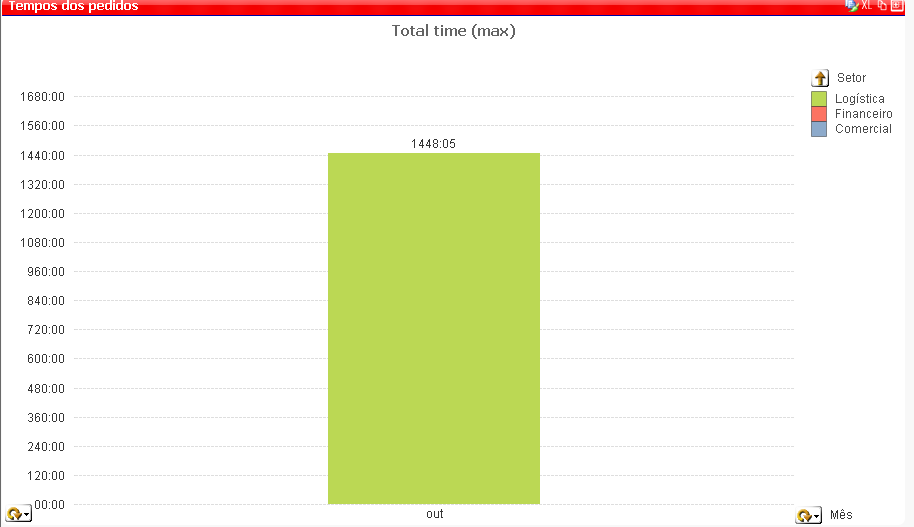
For example: in out/2015 the longer case in Sales dept took 1174h56min and it was PEDIDO=102365. The longer case in Financial dept took 846h36min and it was PEDIDO=102663. The longer case in Logistics dept took 1448h05min and it was PEDIDO=102297.
But the question is: which was the longer PEDIDO in all 3 sectors (from beginning to end of flow)?
I already tried some formulas with Max, Aggr and Sum, but maybe it is not this way.
Does anyone have a solution?
Thanks and best regards,
Henrique
- « Previous Replies
-
- 1
- 2
- Next Replies »
- Mark as New
- Bookmark
- Subscribe
- Mute
- Subscribe to RSS Feed
- Permalink
- Report Inappropriate Content
Henrique Demarco wrote:
But the question is: which was the longer PEDIDO in all 3 sectors (from beginning to end of flow)?
Somewhat, I understand the content, Can you describe more for this part?
- Mark as New
- Bookmark
- Subscribe
- Mute
- Subscribe to RSS Feed
- Permalink
- Report Inappropriate Content
Yes. Might be some misunderstanding due to translation.
PEDIDO is the field name and means Sales Order number.
All Sales Order starts in Comercial (Sales Dept), then some of them goes to Financial and ends in Logistics.
For longest PEDIDO in all 3 sectors I mean longest Sales Order for complete flow, that goes from Comercial to Logistics.
- Mark as New
- Bookmark
- Subscribe
- Mute
- Subscribe to RSS Feed
- Permalink
- Report Inappropriate Content
A workaround for it can be to create a field in script that would calculate interval between PEDIDO (Sales Order) begin and end. With interval it would be possible to find longest PEDIDO and then plot it.
I always try to avoid this kind of solution to save memory and speed up qvw, but can be a solution.
Hope someone can help. 
- Mark as New
- Bookmark
- Subscribe
- Mute
- Subscribe to RSS Feed
- Permalink
- Report Inappropriate Content
try this once
Max(Aggr(dimension,expression))
Max(Aggr(time,saledept))
- Mark as New
- Bookmark
- Subscribe
- Mute
- Subscribe to RSS Feed
- Permalink
- Report Inappropriate Content
Hi Henrique,
if you build a chat direct table with dimensions Perdido and Setor
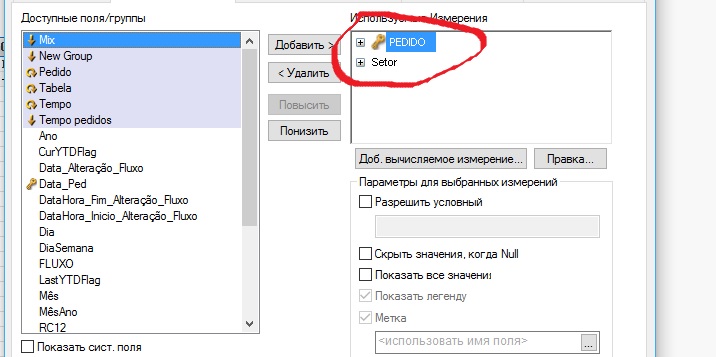
and with expression
If (rank(Max(TOTAL <PEDIDO, Setor> Tempo_total))=1, Max(TOTAL <PEDIDO, Setor> Tempo_total))
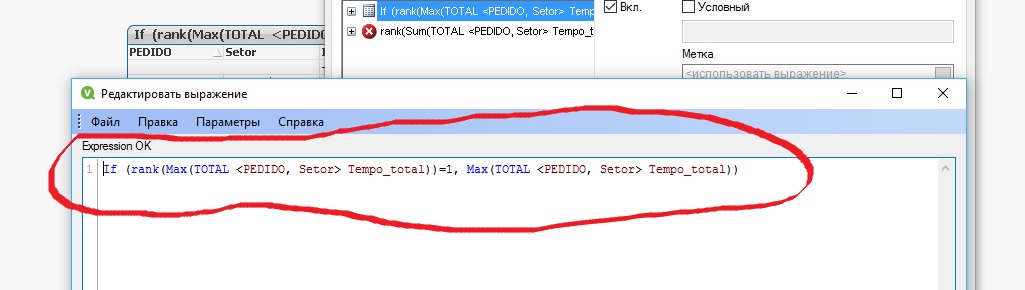
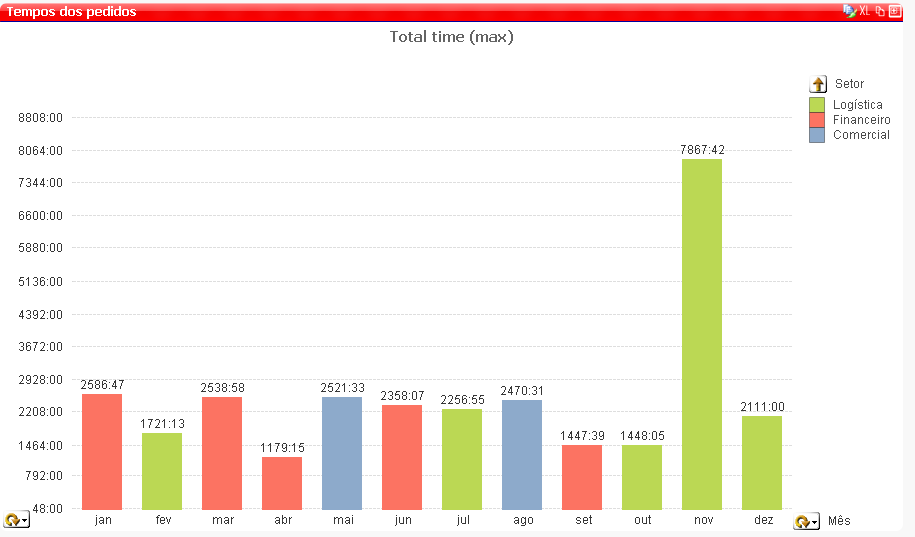
we obtain the following chart.
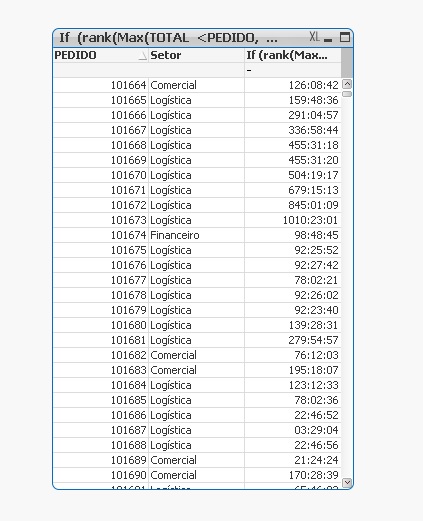
Is this what you want? Maybe this will help solve your problem?
Regards,
Andrey
- Mark as New
- Bookmark
- Subscribe
- Mute
- Subscribe to RSS Feed
- Permalink
- Report Inappropriate Content
Are you hoping to see this?
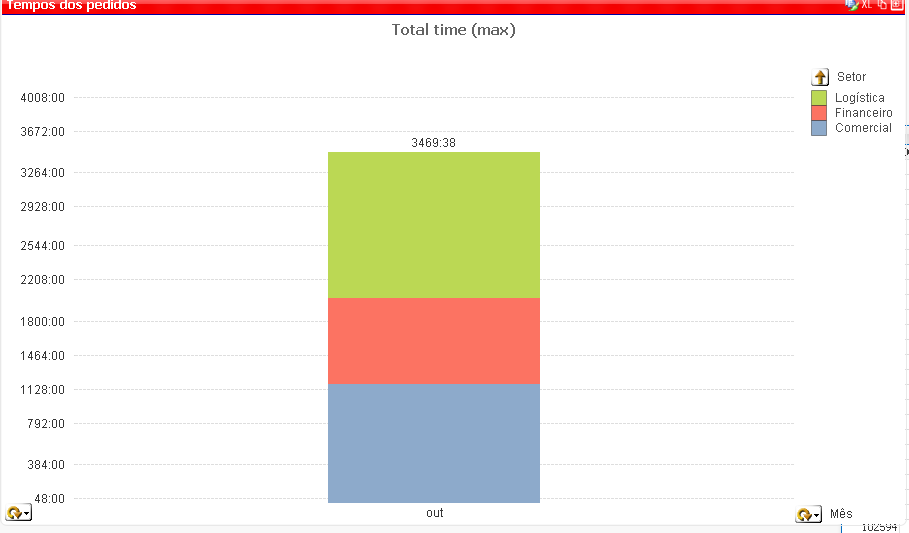
Or are you hoping to see just the Green portion since it is the max among the three sector?
Expression for the second one is this
=If(Max(TOTAL <$(='[' & GetCurrentField([Tempo]) &']')> Aggr(DISTINCT Sum({<Situação_Fluxo-={'11'}>} Tempo_total), Status_Fluxo, PEDIDO)) =
Max(Aggr(DISTINCT Sum({<Situação_Fluxo-={'11'}>} Tempo_total), Status_Fluxo, PEDIDO)),
Max(Aggr(DISTINCT Sum({<Situação_Fluxo-={'11'}>} Tempo_total), Status_Fluxo, PEDIDO)))
Without selection, it looks like this
- Mark as New
- Bookmark
- Subscribe
- Mute
- Subscribe to RSS Feed
- Permalink
- Report Inappropriate Content
Aggr syntax is:
aggr ([ distinct | nodistinct ] [{set_expression}]expression {, dimension})
I already tried this solution without success.
Thanks for your help.
- Mark as New
- Bookmark
- Subscribe
- Mute
- Subscribe to RSS Feed
- Permalink
- Report Inappropriate Content
My proposed solution might not be the one you wanted, but did you get a chance to look at it?
- Mark as New
- Bookmark
- Subscribe
- Mute
- Subscribe to RSS Feed
- Permalink
- Report Inappropriate Content
Hi Andrey,
Your solution is returning the worst (if you consider that a long lead time is not good for business) department for each Pedido (Sales Order).
I am looking for the worst Sales Order in a defined period time, like October 2015.
Lets work with Logistics and Oct 2015. The longest Sales Order for Logistics is 102297, which took 1448:05:38 total time. But is this the longest Sales Order of the company? No.
The longest SO for the company is 102663, that took 933:00:12 in Comercial dept and 846:36:46 in Financial and counting, because it did not get to Logistics yet.
Remember SO's flow is Comercial -> Financial -> Logistics.
If you see SO 102663 is not the worst case among 3 departments, but is the worst case of the company.
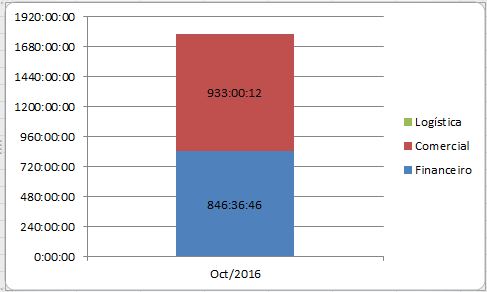
In my case, I would like to plot the worst company case with total time on each department. In case of 102663, Logistics would not appear in chart because it has 0min of lead time.
Here an example in a Excel pivot table:
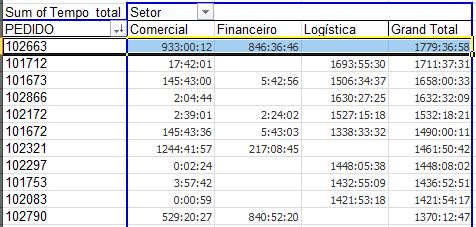
Chart should be something like that:
Thanks for your help and quick answer.
Henrique
- « Previous Replies
-
- 1
- 2
- Next Replies »