Unlock a world of possibilities! Login now and discover the exclusive benefits awaiting you.
- Qlik Community
- :
- Forums
- :
- Analytics
- :
- New to Qlik Analytics
- :
- Re: Date Variable in Set Analysis
- Subscribe to RSS Feed
- Mark Topic as New
- Mark Topic as Read
- Float this Topic for Current User
- Bookmark
- Subscribe
- Mute
- Printer Friendly Page
- Mark as New
- Bookmark
- Subscribe
- Mute
- Subscribe to RSS Feed
- Permalink
- Report Inappropriate Content
Date Variable in Set Analysis
Hi Team,
I have a variable vR3Date which contains a date in DD-MM-YYYY format.
This variable value is set during the load script.
how can can I use this variable in following expression to only show sum where SalesDate is >= the variable date?
=SUM(SoldUnits)
Thanks you
- Mark as New
- Bookmark
- Subscribe
- Mute
- Subscribe to RSS Feed
- Permalink
- Report Inappropriate Content
Hi Lokesh,
To do this you can used the script below.Be careful when comparing the SalesDate vs the vR3Date value.
Always ensure that they are on the same format.
= Sum({<SalesDate = {'>=$(vR3Date)'}>}SoldUnits)
Thanks,
Christian
- Mark as New
- Bookmark
- Subscribe
- Mute
- Subscribe to RSS Feed
- Permalink
- Report Inappropriate Content
Thanks Christian
I also have another expression to check share of units sold by product name and currently use following expression.
how would I use that date variable to only show result where Sales Date is >= vR3Date
=Num(Sum(SoldUnits) / Sum(TOTAL <Manager> {<Product>} SoldUnits),'0.0%')
Thanks
- Mark as New
- Bookmark
- Subscribe
- Mute
- Subscribe to RSS Feed
- Permalink
- Report Inappropriate Content
what are the condition you want to include for Manager and Product? Do you want to ignore selections under those fields?
- Mark as New
- Bookmark
- Subscribe
- Mute
- Subscribe to RSS Feed
- Permalink
- Report Inappropriate Content
Hi Lokesh,
By using set analysis you can write as follows,
=Sum({<salesDate={'>=$(vR3Date)'}>}SoldUnits).
Regards,
Murali Mohan.T
- Mark as New
- Bookmark
- Subscribe
- Mute
- Subscribe to RSS Feed
- Permalink
- Report Inappropriate Content
Good Question 
I would still like the data to be selected under Manager and Product.
The reason I am using those two field is because I am showing Product Shares by Manager names and when any one of the product is selected then the bar chart will show comparison for that specific product only.
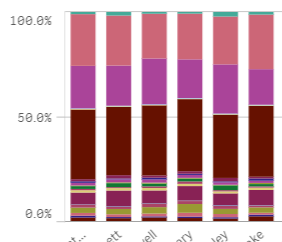
So I would like the >= condition applied in that expression
=Num(Sum(SoldUnits) / Sum(TOTAL <Manager> {<Product>} SoldUnits),'0.0%')
Thank you
- Mark as New
- Bookmark
- Subscribe
- Mute
- Subscribe to RSS Feed
- Permalink
- Report Inappropriate Content
Thank you Murli,
Can you help with the reply I just posted on Christian's answer.
- Mark as New
- Bookmark
- Subscribe
- Mute
- Subscribe to RSS Feed
- Permalink
- Report Inappropriate Content
Hi Lokesh,
Can you share a sample dummy data?
Thanks,
Christian
- Mark as New
- Bookmark
- Subscribe
- Mute
- Subscribe to RSS Feed
- Permalink
- Report Inappropriate Content
Hi Christian,
Please find attached QVF & Excel file (for sample data)
I only want that bar chart to show rolling quarter data.
For that I have also did an inline load to get filter like (R3, R6, R12) but I don't know how to change expression based on that filters
So as an example, If R3 is selected then the expression in that bar chart will show rolling quarter
If R6 is selected then it will show Rolling 6 months.. and so on.
Hope you can help
Thanks