Unlock a world of possibilities! Login now and discover the exclusive benefits awaiting you.
- Qlik Community
- :
- All Forums
- :
- QlikView App Dev
- :
- Re: text on a background - chart
- Subscribe to RSS Feed
- Mark Topic as New
- Mark Topic as Read
- Float this Topic for Current User
- Bookmark
- Subscribe
- Mute
- Printer Friendly Page
- Mark as New
- Bookmark
- Subscribe
- Mute
- Subscribe to RSS Feed
- Permalink
- Report Inappropriate Content
text on a background - chart
Hi,
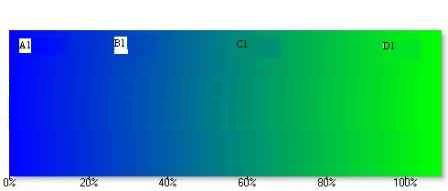
Has anybody tried displaying some text on a chart background. I have attached a screenshot of the same. Basically, I am looking for putting some text on the chart based on the X-axis values. As visible in the screenshot, 'A1' corresponds to the RED or the low region, while text 'D1' is visible in the green or the high region.
Accepted Solutions
- Mark as New
- Bookmark
- Subscribe
- Mute
- Subscribe to RSS Feed
- Permalink
- Report Inappropriate Content
if you want textboxes above the chart make sure to put them on the top level (layout tab)
- Mark as New
- Bookmark
- Subscribe
- Mute
- Subscribe to RSS Feed
- Permalink
- Report Inappropriate Content
You may choose the option "Values on DataPoints". With Text in Chart, you alway will have fixed positions, which may cause some problem, if not all values are selected etc.
See the attached - only thing is that you cannot change the background behind the values (white in your screenshot)
HTH
Peter
- Mark as New
- Bookmark
- Subscribe
- Mute
- Subscribe to RSS Feed
- Permalink
- Report Inappropriate Content
thanks for the prompt reply and sorry for the confusion.... these white background images were created manually (using paint).
i was looking for a static data, this will not change as per the selection....
i have attached another screenshot... the text a1, b1, c1, d1 are supposed to be static and must not change...
reason: even after any selection, the range of X axis will be from 0 to 100%....
- Mark as New
- Bookmark
- Subscribe
- Mute
- Subscribe to RSS Feed
- Permalink
- Report Inappropriate Content
or is it possible to just put text boxes on the above chart at 4 different locations.
I tried that, but the text box disappears under the chart... 
- Mark as New
- Bookmark
- Subscribe
- Mute
- Subscribe to RSS Feed
- Permalink
- Report Inappropriate Content
if you want textboxes above the chart make sure to put them on the top level (layout tab)
- Mark as New
- Bookmark
- Subscribe
- Mute
- Subscribe to RSS Feed
- Permalink
- Report Inappropriate Content
thanks Johan, the fix was great...