Unlock a world of possibilities! Login now and discover the exclusive benefits awaiting you.
- Qlik Community
- :
- Forums
- :
- Analytics
- :
- New to Qlik Analytics
- :
- Custom range for Y-axis as maximum value of the me...
Options
- Subscribe to RSS Feed
- Mark Topic as New
- Mark Topic as Read
- Float this Topic for Current User
- Bookmark
- Subscribe
- Mute
- Printer Friendly Page
Turn on suggestions
Auto-suggest helps you quickly narrow down your search results by suggesting possible matches as you type.
Showing results for
Creator III
2017-01-31
12:09 PM
- Mark as New
- Bookmark
- Subscribe
- Mute
- Subscribe to RSS Feed
- Permalink
- Report Inappropriate Content
Custom range for Y-axis as maximum value of the measure + fix number
Hi
I use two dimensions on my chart:
1. "Week of the Year"
2. Year
The result is as follows:
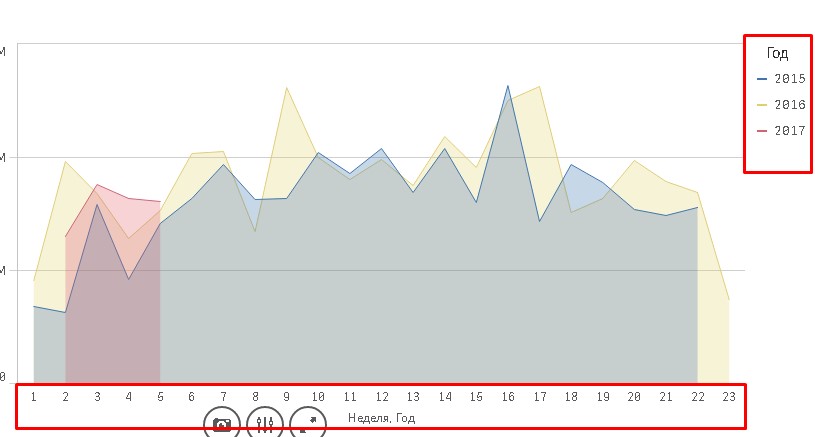
Now I want to create a custom range for the Y-axis, which is the maximum weekly sales out of the filtered range (in the example it is the week 16) plus fixed value.
The formula I put is:
Max([Sales])+{1.000.000}
It does not work.
Am i missing something?
- Tags:
- custom range
3,434 Views
1 Solution
Accepted Solutions
Anonymous
Not applicable
2017-01-31
02:26 PM
- Mark as New
- Bookmark
- Subscribe
- Mute
- Subscribe to RSS Feed
- Permalink
- Report Inappropriate Content
You need max of weekly sales, so probably this
max(aggr(sum(Sales),Week,Year)) + ....
2 Replies
Anonymous
Not applicable
2017-01-31
02:26 PM
- Mark as New
- Bookmark
- Subscribe
- Mute
- Subscribe to RSS Feed
- Permalink
- Report Inappropriate Content
You need max of weekly sales, so probably this
max(aggr(sum(Sales),Week,Year)) + ....
Creator III
2017-02-01
04:56 AM
Author
- Mark as New
- Bookmark
- Subscribe
- Mute
- Subscribe to RSS Feed
- Permalink
- Report Inappropriate Content
Works fine.
I now understand the logic, thank you.
2,910 Views
Community Browser