Unlock a world of possibilities! Login now and discover the exclusive benefits awaiting you.
- Qlik Community
- :
- Forums
- :
- Analytics
- :
- New to Qlik Analytics
- :
- hide value in line chart
- Subscribe to RSS Feed
- Mark Topic as New
- Mark Topic as Read
- Float this Topic for Current User
- Bookmark
- Subscribe
- Mute
- Printer Friendly Page
- Mark as New
- Bookmark
- Subscribe
- Mute
- Subscribe to RSS Feed
- Permalink
- Report Inappropriate Content
hide value in line chart
Hi everyone,
I have been trying to hide a value of a dimension ("NOTREFERRED") in a line chart using the expression IF([Reason for Referal] <> 'NOTREFERRED', [Reason for Referal]). But although the value of "NOTREFERRED" is not showing in the legend, the line is still in the line chart and grayed out (as shown below).
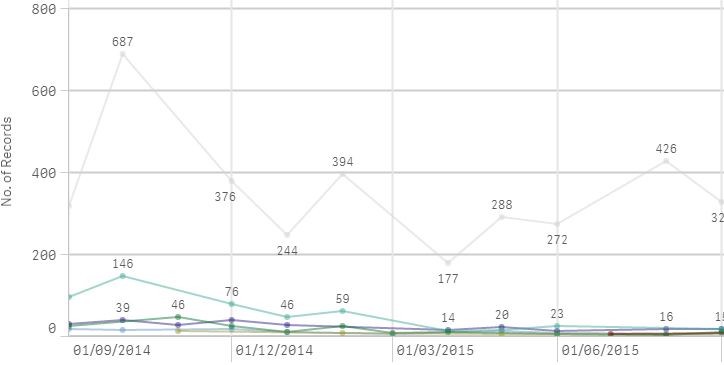
I would like it to disappear so that all other lines can move up and I can see clearer difference among the other values. How do I do it?
Thanks in advance!
Accepted Solutions
- Mark as New
- Bookmark
- Subscribe
- Mute
- Subscribe to RSS Feed
- Permalink
- Report Inappropriate Content
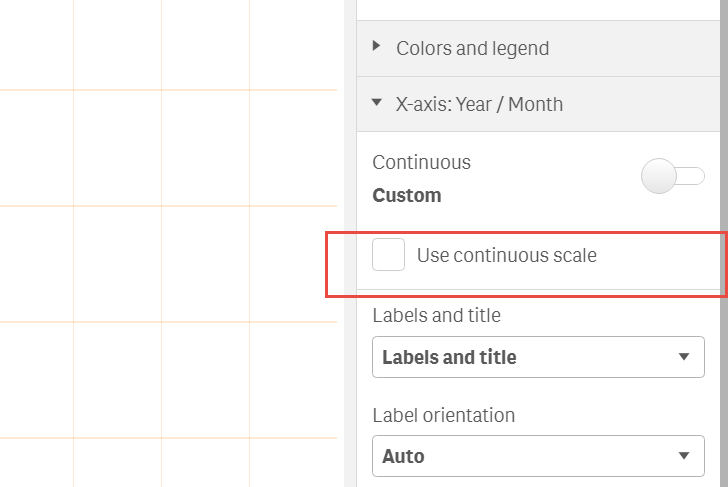
It is the way Qlik was designed. What is interfering with "show null values" checkbox is a "Use continuous scale" checkbox you have probably on on X Axis!
If you disable it then you will be able to uncheck "show null values" values check box under dimension.
If you think about it then tt is kind of obvious as continous scale by default has to take into consideration non existing data and therefore option of "show null values" under dimension is diapearing - right?.
hope this solves your querry
regards
Lech
- Mark as New
- Bookmark
- Subscribe
- Mute
- Subscribe to RSS Feed
- Permalink
- Report Inappropriate Content
What happens when you actualy filter that column in filter pane and dont select "NOTREFERRED" value. Does it dissapear from your chart then?
- Mark as New
- Bookmark
- Subscribe
- Mute
- Subscribe to RSS Feed
- Permalink
- Report Inappropriate Content
Yes it does disappear if I filter it out.
However I don't want it to use filter because this will affect other charts. How can I get rid of it from the chart?
- Mark as New
- Bookmark
- Subscribe
- Mute
- Subscribe to RSS Feed
- Permalink
- Report Inappropriate Content
When I use a simple line chart with only one dimension, I could use the expression and uncheck "Show null values" so that this value doesn't show (if I keep "Show null values" checked then it'd still show in the chart with the value changed to blank).
However I'm using two dimensions (adding the date dimension) because I want to see the trend, then I don't have the option of "Show null values".
I have hence found a work-around where I delete the date dimension, uncheck the "Show null values", then put the date dimension back. It now works.
Just wonder if there's a better way of doing it...
- Mark as New
- Bookmark
- Subscribe
- Mute
- Subscribe to RSS Feed
- Permalink
- Report Inappropriate Content
It is the way Qlik was designed. What is interfering with "show null values" checkbox is a "Use continuous scale" checkbox you have probably on on X Axis!
If you disable it then you will be able to uncheck "show null values" values check box under dimension.
If you think about it then tt is kind of obvious as continous scale by default has to take into consideration non existing data and therefore option of "show null values" under dimension is diapearing - right?.
hope this solves your querry
regards
Lech
- Mark as New
- Bookmark
- Subscribe
- Mute
- Subscribe to RSS Feed
- Permalink
- Report Inappropriate Content
Wow Lech what you described solved my problem beautifully! I wonder how you guys get to know all these tricks...Is there any book or website that teaches how these sections relate to each other?
- Mark as New
- Bookmark
- Subscribe
- Mute
- Subscribe to RSS Feed
- Permalink
- Report Inappropriate Content
You just learn on the job. All those things with QlikSense are still new so even Qlik Help document is not up to date. However i use it very often to see how properties are designed:
for example:
https://help.qlik.com/en-US/sense/3.1/Subsystems/Hub/Content/Visualizations/time-aware-charts.htm
There is no up-to-date book which will describe all functionalities of Qlik Sense (related to UI objects). If you are looking for good read in regards to script and backend and expressions then you can use QlikView related books as a learning source. 90% of knowledge will apply to QlikSense as well!
These are my favorite ones:
- Amazon.com: QlikView 11 for Developers (9781849686068): Barry Harmsen, Miguel Garcia: Books
- Amazon.com: Mastering QlikView (9781782173298): Stephen Redmond: Books
- QlikView Your Business: An expert guide to Business Discovery with QlikView and Qlik Sense Paperback...
- Amazon.com: QlikView for Developers Cookbook (9781782179733): Stephen Redmond: Books
If you go through them you will learn a LOOOOOT about Qlik world.
regards
Lech