Unlock a world of possibilities! Login now and discover the exclusive benefits awaiting you.
- Qlik Community
- :
- All Forums
- :
- QlikView App Dev
- :
- Re: Summarising the output of an expression
- Subscribe to RSS Feed
- Mark Topic as New
- Mark Topic as Read
- Float this Topic for Current User
- Bookmark
- Subscribe
- Mute
- Printer Friendly Page
- Mark as New
- Bookmark
- Subscribe
- Mute
- Subscribe to RSS Feed
- Permalink
- Report Inappropriate Content
Summarising the output of an expression
Dear all,
I have a large table of time stamps that I wish to analyse to find the average time it takes to complete certain actions.
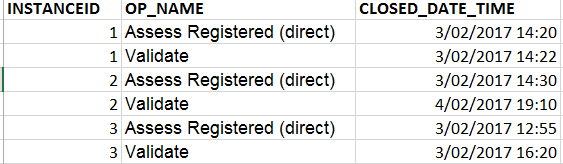
The table could be summarized as follows:
INSTANCEID - A key that links all rows in the table related to a specific transation
OP_NAME - The type of operation
CLOSED_DATE_TIME - Timestamp
A small data sample might look like this:
I have written an expression as per below that gives me a list of intervals between two timestamps from the currently selected data, as below:
=Interval(Only({$<OP_NAME={'Assess Registered (direct)'}>}CLOSED_DATE_TIME))-(Only({$<OP_NAME={'Validate'}>}CLOSED_DATE_TIME))
If I put this expression in a Simple Chart using INSTANCEID as a dimension, I get a correct list of intervals across the selected data. Furthermore, I can Select 'Average of rows' in the Expression tab which gives me the average of the intervals shows, which is exactly the result I require.
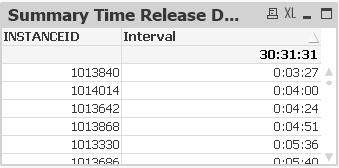
My question related to displaying the information.
I just want to display one number, the average of all the selected Timestamp Intervals, in this case 30:31:31, but not display the actual data.
How do I achieve this? I am assuming that I need to use a combination of Avg, Aggr, and Only functions around the expression shown above to achieve this but I am getting confused.
Can anyone point me in the right direction please?
- Mark as New
- Bookmark
- Subscribe
- Mute
- Subscribe to RSS Feed
- Permalink
- Report Inappropriate Content
You want to display this in a text box object? and what exactly are you doing here? Summing the interval for individual INSTANCEIDs to get 30:31:31?
- Mark as New
- Bookmark
- Subscribe
- Mute
- Subscribe to RSS Feed
- Permalink
- Report Inappropriate Content
Dear Sunny,
Apologies for my lack of clarity. The number 30:31:31 is the average of the intervals of each INSTANCEID.
As per the sample data provided it would be calculated as follows
INSTANCEID 1 Interval 00:02.00 (2 mins)
INSTANCEID 2 Interval 29:05.00 (29 hours and 5 minutes)
INSTANCEID 3 Interval 03:25.00 (3 hours and 5 minutes)
Average interval is 32:32.00 / 3 = 10:50.40
The Expression shown in the first posting lists all the intervals based on the currently selected data. I want to just display the mean average of the intervals in a text box. Hope you can help me with the syntax.
Thanks in advance.
- Mark as New
- Bookmark
- Subscribe
- Mute
- Subscribe to RSS Feed
- Permalink
- Report Inappropriate Content
Give this a shot:
=Interval(Avg(Aggr(Only({$<OP_NAME={'Assess Registered (direct)'}>}CLOSED_DATE_TIME))-(Only({$<OP_NAME={'Validate'}>}CLOSED_DATE_TIME), INSTANCEID)))
- Mark as New
- Bookmark
- Subscribe
- Mute
- Subscribe to RSS Feed
- Permalink
- Report Inappropriate Content
Dear Sunny,
I'm getting the message 'Error: Error in Expression: Aggr takes at least 2 parameters when using that formula in a text box'. Can you give me any advice on resolving this syntax issue? From a bit of googling, it looks like I need to give the command a second dimension/ expression to work with; but i'm a bit confused.
Hope you can help.
- Mark as New
- Bookmark
- Subscribe
- Mute
- Subscribe to RSS Feed
- Permalink
- Report Inappropriate Content
Based on Sunny's expression it is just a bracket closed for Aggr in a different place. Just try this? The aggr bracket was close just before the minus symbol.
=Interval(
Avg(
Aggr(
Only({$<OP_NAME={'Assess Registered (direct)'}>}CLOSED_DATE_TIME) -
Only({$<OP_NAME={'Validate'}>}CLOSED_DATE_TIME) , INSTANCEID
)
)
)
- Mark as New
- Bookmark
- Subscribe
- Mute
- Subscribe to RSS Feed
- Permalink
- Report Inappropriate Content
Brilliant; that's working. Thanks for the Syntax correction Vishwarath.