Unlock a world of possibilities! Login now and discover the exclusive benefits awaiting you.
- Qlik Community
- :
- Forums
- :
- Groups
- :
- Location and Language
- :
- Россия и СНГ
- :
- Re: Сводная таблица. Пределы измерения
- Subscribe to RSS Feed
- Mark Topic as New
- Mark Topic as Read
- Float this Topic for Current User
- Bookmark
- Subscribe
- Mute
- Printer Friendly Page
- Feature this Topic
- Mark as New
- Bookmark
- Subscribe
- Mute
- Subscribe to RSS Feed
- Permalink
- Report Inappropriate Content
Сводная таблица. Пределы измерения
Всем привет
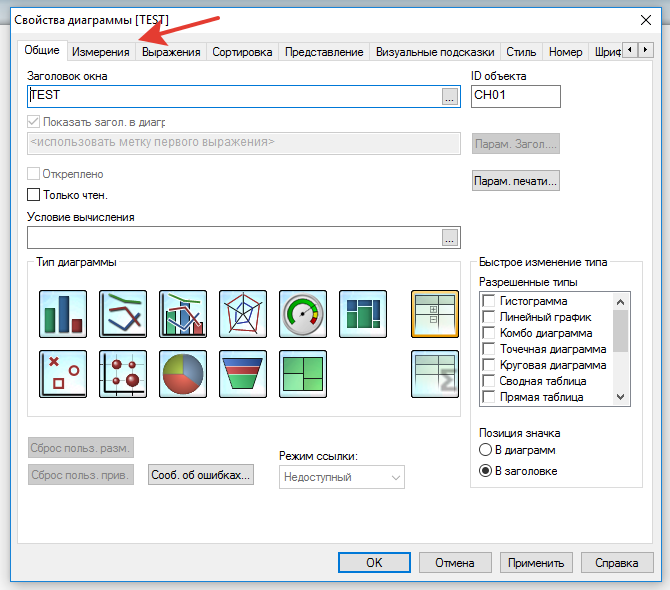
Вопрос: возможно ли ограничить пределы измерения в сводной таблице, как это позволяет функционал в диаграммах?
При выборе сводной таблицы вкладка специальная вкладка пропадает,
но ранее видел демонстрацию сводной таблицы, в которой было ограничение по некоторому измерению. Задачка там была: отображались топ 5 контрагентов по продажам внутри каждого региона (измерения - регион и контрагент, выражение - сумма продаж)
Accepted Solutions
- Mark as New
- Bookmark
- Subscribe
- Mute
- Subscribe to RSS Feed
- Permalink
- Report Inappropriate Content
There are two ways to achieve this
1)using a calculated dimension
2)restrict values in set analysis
Example: to show top 5 companies by sales
1)to restrict dimension values, add calculated dimension as below
If (Aggr (Rank (Sum (sales)),Company)<=5,Company) // and check suppress when value is null on this dimension
2)to restrict in set analysis
Sum ( {< Company = {"=Company = Rank (Sum(Sales))<=5"}
>}Sales)
If a post helps to resolve your issue, please accept it as a Solution.
- Mark as New
- Bookmark
- Subscribe
- Mute
- Subscribe to RSS Feed
- Permalink
- Report Inappropriate Content
Thanks
1) - its all ok 
2) - doesn't work. maybe i made a mistake.
Can you fix it in file?
- Mark as New
- Bookmark
- Subscribe
- Mute
- Subscribe to RSS Feed
- Permalink
- Report Inappropriate Content
I'm on mobile right now 
Also, with the second method there is a possibility that we may need a keyfield
If a post helps to resolve your issue, please accept it as a Solution.
- Mark as New
- Bookmark
- Subscribe
- Mute
- Subscribe to RSS Feed
- Permalink
- Report Inappropriate Content
Or may be try
Sum ( {< Company = {"=Rank (Sum(Sales))<=5"}
>}Sales)
If a post helps to resolve your issue, please accept it as a Solution.
- Mark as New
- Bookmark
- Subscribe
- Mute
- Subscribe to RSS Feed
- Permalink
- Report Inappropriate Content
It's ok!
Thanks bro
- Mark as New
- Bookmark
- Subscribe
- Mute
- Subscribe to RSS Feed
- Permalink
- Report Inappropriate Content
Just checked your app buddy
you need to use double quotes
Sum({<Organization={"= Rank(Sum(Sales),4,1)<=3"}>}Sales)
cheers
V
If a post helps to resolve your issue, please accept it as a Solution.