Unlock a world of possibilities! Login now and discover the exclusive benefits awaiting you.
- Qlik Community
- :
- All Forums
- :
- QlikView App Dev
- :
- Re: Correlation Analysis on two columns of a Pivot...
- Subscribe to RSS Feed
- Mark Topic as New
- Mark Topic as Read
- Float this Topic for Current User
- Bookmark
- Subscribe
- Mute
- Printer Friendly Page
- Mark as New
- Bookmark
- Subscribe
- Mute
- Subscribe to RSS Feed
- Permalink
- Report Inappropriate Content
Correlation Analysis on two columns of a Pivot Chart
I need help in figuring out a way to do a correlation analysis on two columns of a Pivot Chart.
I have following two dimensions in my dataset
1. Trade Date
2. Exchange ( this has values like NYSE, NASDAQ, CME, etc)
and the Measure is
1. Trade Value ( numeric)
Question -
I created a Pivot chart on the above mention dataset. It looks something like below.
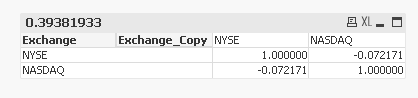
Is there an easy way to perform a correlation analysis on two columns of a Pivot Chart???
I want to perform Correl(NYSE, NASDAQ). These two columns are field values of the Dimension - Exchange.
| Trade Date | NYSE | NASDAQ |
|---|---|---|
1/1/2014 | 3 | 2 |
| 1/2/2014 | 4 | 16 |
| 1/3/2014 | 5 | 15 |
| 1/4/2014 | 12 | 6 |
| 1/5/2014 | 9 | 14 |
- « Previous Replies
-
- 1
- 2
- Next Replies »
- Mark as New
- Bookmark
- Subscribe
- Mute
- Subscribe to RSS Feed
- Permalink
- Report Inappropriate Content
Hi,
Have a look at the document given on below link. That will help.
Understanding Correlation Analysis and how to apply to Qlikview.docx
Regards,
Kaushik Solanki
- Mark as New
- Bookmark
- Subscribe
- Mute
- Subscribe to RSS Feed
- Permalink
- Report Inappropriate Content
- Mark as New
- Bookmark
- Subscribe
- Mute
- Subscribe to RSS Feed
- Permalink
- Report Inappropriate Content
You just beat me to it!
- Mark as New
- Bookmark
- Subscribe
- Mute
- Subscribe to RSS Feed
- Permalink
- Report Inappropriate Content
This?
- Mark as New
- Bookmark
- Subscribe
- Mute
- Subscribe to RSS Feed
- Permalink
- Report Inappropriate Content
Haha,
Doesnt matter who beats whom. What matters is that Vaibhav gets the help he is seeking for. 
Regards,
Kaushik Solanki
- Mark as New
- Bookmark
- Subscribe
- Mute
- Subscribe to RSS Feed
- Permalink
- Report Inappropriate Content
This works only if you have two measures.
My issue is that I need correlation on same measure but on difference values of the dimension, aggregated by Trade date.
- Mark as New
- Bookmark
- Subscribe
- Mute
- Subscribe to RSS Feed
- Permalink
- Report Inappropriate Content
Then you should use the Generic load in script to create a separate field for each value of your dimension.
Help in Generic load.
https://community.qlik.com/blogs/qlikviewdesignblog/2014/03/31/generic
Regards,
Kaushik Solanki
- Mark as New
- Bookmark
- Subscribe
- Mute
- Subscribe to RSS Feed
- Permalink
- Report Inappropriate Content
I have 100 Million + rows
Not sure if my laptop can handle two similar version of such a huge data at the same time.
- Mark as New
- Bookmark
- Subscribe
- Mute
- Subscribe to RSS Feed
- Permalink
- Report Inappropriate Content
Perform the Correl in the script? Does it have to change based on selections? I don't see another way to do correlation unless I have not been exposed to it .
Also, is the output what you want or no?
- « Previous Replies
-
- 1
- 2
- Next Replies »