Unlock a world of possibilities! Login now and discover the exclusive benefits awaiting you.
- Qlik Community
- :
- All Forums
- :
- QlikView App Dev
- :
- Re: How to use colour saturation as an indicator?
- Subscribe to RSS Feed
- Mark Topic as New
- Mark Topic as Read
- Float this Topic for Current User
- Bookmark
- Subscribe
- Mute
- Printer Friendly Page
- Mark as New
- Bookmark
- Subscribe
- Mute
- Subscribe to RSS Feed
- Permalink
- Report Inappropriate Content
How to use colour saturation as an indicator?
Hi All
Basically I am showing on a daily basis the number of people seen within certain time bands.
is there an easy way of doing something like this please? I would like to show the idea that "0(minus)" is good so GREEN, 30 to 60 is caution so YELLOW and "360+" as dangerous so RED - like traffic lights.
Is there are formula I can use for doing this? (for example adding more red to the RGB component as you go from one dimension to the other?)
Is there a better way of doing this?
Jo

I have looked here:
and that was good! and then I found out how to replace the <=x< and that was good too! , Relabelling Class Function Groupshttps://community.qlik.com/message/671679#671679
so now I would like the colour changes to be more automatic than me putting in RGB values.
- Mark as New
- Bookmark
- Subscribe
- Mute
- Subscribe to RSS Feed
- Permalink
- Report Inappropriate Content
Hello,
Late reply, but did you try colormix wizard?
1. Open "Background color" property of the Expression
2. Click on ... in the Expression Definition, to see whole window
3. Go to File -> Colormix wizard
You can read more in help: https://help.qlik.com/en-US/qlikview/12.1/Subsystems/Client/Content/Colormix_Wizard.htm
BR,
Kuba
- Mark as New
- Bookmark
- Subscribe
- Mute
- Subscribe to RSS Feed
- Permalink
- Report Inappropriate Content
Hi Jakub
That is what I would like but ...
I have an expression: Count(Band of Interest)
For example - if the Band of Interest is 300+ then i want the count to be in RED, but if the Band of Interest is 0 then i want the count to be in Green.
So I will try count(of MinsWaited) as my expression to apy the colour to.
Ah maybe ...remove the secondary dimension ???
Jo
- Mark as New
- Bookmark
- Subscribe
- Mute
- Subscribe to RSS Feed
- Permalink
- Report Inappropriate Content
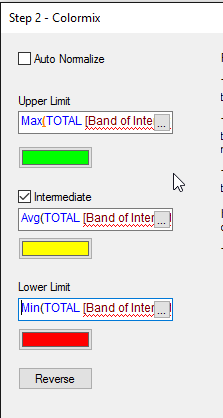
You can specify dynamic ranges in Colormix Wizard settings:
(i do not know your expression, and you may want to use aggr there to specify proper max/min)
- Mark as New
- Bookmark
- Subscribe
- Mute
- Subscribe to RSS Feed
- Permalink
- Report Inappropriate Content
Hi Jakub
I think this is a bit more complicated ...
The expression is "count how many people have a WaitingTime of more than 60 mins, more than 90 mins, more than 100 mnis), so it is not a straight expression.
so to do this I used the Class function which calculated this automatically - it counts the number of patients within 100 minute bands.
I don't think the ClolorMix wizard can do this - I think I need to choose each colour within the band.
Values would be something like:
Person1 waited 40 mins
Person2 waited 20 mins
Person3 did not wait
so for example on the 31/1/2017 there were 14 people seen before their appointment time, 12 were seen within 30 mins of their appointment time, 23 were seen between 30 and 60 mins of their appointment time.
I think the only thing I can do is in the colors tab - change the colours.
