Unlock a world of possibilities! Login now and discover the exclusive benefits awaiting you.
- Qlik Community
- :
- All Forums
- :
- QlikView App Dev
- :
- Individual PIE charts to display 100%
- Subscribe to RSS Feed
- Mark Topic as New
- Mark Topic as Read
- Float this Topic for Current User
- Bookmark
- Subscribe
- Mute
- Printer Friendly Page
- Mark as New
- Bookmark
- Subscribe
- Mute
- Subscribe to RSS Feed
- Permalink
- Report Inappropriate Content
Individual PIE charts to display 100%
Hi All,
I have a typical requirement where the Total of Single PIE has to be 100%.
I am displaying Trellis chart for the User.
When 3 Products and 3 Months for example P1, P2 and P3 are selected and months selected are 201010, 201011 and 201012, following data is displayed in Pivot table.
201010 201011 201012
P1 10 20 30
P2 20 40 60
P3 30 60 90
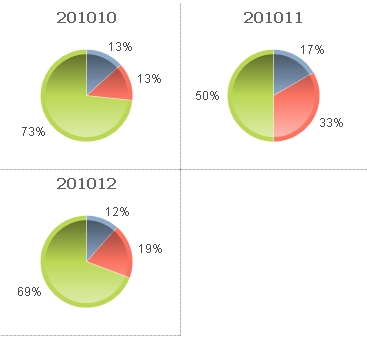
Now, when i display the same in Trellis PIE chart, it displays as
for 201010, P1 has 10/360= 2.7%
for 201010, P2 has 20/360 = 5.4%
for 201010, P3 has 30/360=11.2%
Hence the total for 201010 PIE is 19.3%, but end user requirment is total of PIE percentages should be 100%.
Can this be achieved?
- Tags:
- new_to_qlikview
- Mark as New
- Bookmark
- Subscribe
- Mute
- Subscribe to RSS Feed
- Permalink
- Report Inappropriate Content
Hi,
Assuming that your fields are Product, Month and Qty you can put this expression (not a relative one) in your treillis :
=sum(Qty)/sum(total <Month> Qty)
With Month as the first dimension and Product the second one.
Regards,
Vincent
- Mark as New
- Bookmark
- Subscribe
- Mute
- Subscribe to RSS Feed
- Permalink
- Report Inappropriate Content
Thank you Vincent!!...it works!