Unlock a world of possibilities! Login now and discover the exclusive benefits awaiting you.
- Qlik Community
- :
- Forums
- :
- Analytics
- :
- New to Qlik Analytics
- :
- Re: Sorting issue in line graph in Qliksense
- Subscribe to RSS Feed
- Mark Topic as New
- Mark Topic as Read
- Float this Topic for Current User
- Bookmark
- Subscribe
- Mute
- Printer Friendly Page
- Mark as New
- Bookmark
- Subscribe
- Mute
- Subscribe to RSS Feed
- Permalink
- Report Inappropriate Content
Sorting issue in line graph in Qliksense
Hi,
i have a graph which shows data for last 8 weeks, with
Dimension: Week
Expression: Count(Invitation)
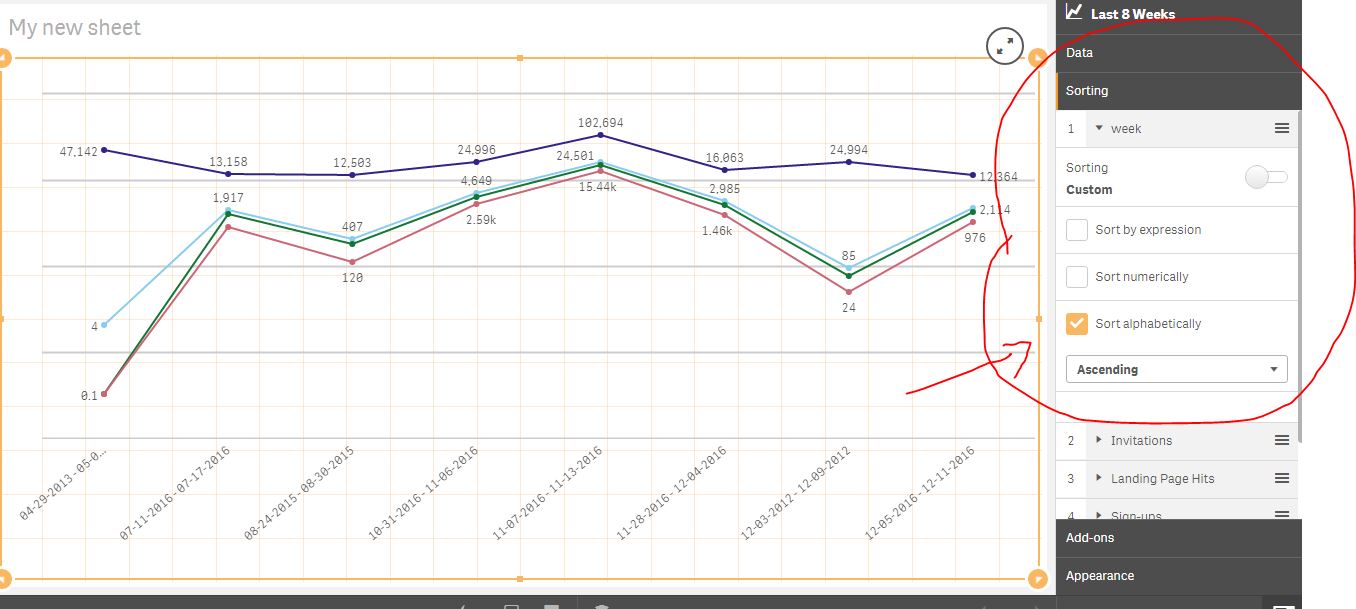
Here i need to display graph to show data with order of week in ascending order. Currently week is jumbled. How to sort it in week order.
I have made all to auto sorting in Sorting Tab of Qliksense.
- « Previous Replies
-
- 1
- 2
- Next Replies »
- Mark as New
- Bookmark
- Subscribe
- Mute
- Subscribe to RSS Feed
- Permalink
- Report Inappropriate Content
replace Datefield with the field using which you are creating the weeks!
If a post helps to resolve your issue, please accept it as a Solution.
- Mark as New
- Bookmark
- Subscribe
- Mute
- Subscribe to RSS Feed
- Permalink
- Report Inappropriate Content
Thanks for reply!
No vineeth, its not working. Can you download attached qvf file.
- Mark as New
- Bookmark
- Subscribe
- Mute
- Subscribe to RSS Feed
- Permalink
- Report Inappropriate Content
I am not able to view your sent file.Its not atall opening
- Mark as New
- Bookmark
- Subscribe
- Mute
- Subscribe to RSS Feed
- Permalink
- Report Inappropriate Content
Go to your thread you may get it.
Otherwise Do this below mentioned,
- Mark as New
- Bookmark
- Subscribe
- Mute
- Subscribe to RSS Feed
- Permalink
- Report Inappropriate Content
Hi,
But when i limit it to show last 8 weeks as mentioned below, it has to show latest weeks. Here it showing someother weeks.
19 dec 2016 -25 dec 2016
26 de 2016 -01 jan 2017
02 jan 2017 -08 jan 2017
09 jan 2017 - 15 jan 2017
16 jan 2017 -22 jan 2017
23 jan 2017 -29 jan 2017
30 jan 2017 -05 feb 2017
06 feb 2017 -12 feb 2017.
- Mark as New
- Bookmark
- Subscribe
- Mute
- Subscribe to RSS Feed
- Permalink
- Report Inappropriate Content
Try
=WeekYear(CanonicalDate)
If a post helps to resolve your issue, please accept it as a Solution.
- Mark as New
- Bookmark
- Subscribe
- Mute
- Subscribe to RSS Feed
- Permalink
- Report Inappropriate Content
See attached app
If a post helps to resolve your issue, please accept it as a Solution.
- Mark as New
- Bookmark
- Subscribe
- Mute
- Subscribe to RSS Feed
- Permalink
- Report Inappropriate Content
Hi Vineeth,
i need to display last 8 weeks data in order in line graph, not in table(in attached sample it displays 2016 canonical date).
For this below date i need to display line graph
19 dec 2016 -25 dec 2016
26 de 2016 -01 jan 2017
02 jan 2017 -08 jan 2017
09 jan 2017 - 15 jan 2017
16 jan 2017 -22 jan 2017
23 jan 2017 -29 jan 2017
30 jan 2017 -05 feb 2017
06 feb 2017 -12 feb 2017.
- Mark as New
- Bookmark
- Subscribe
- Mute
- Subscribe to RSS Feed
- Permalink
- Report Inappropriate Content
See updated APP
created a variable
MaxWeekStart = WeekStart(Max(CanonicalDate)-56)
and used this variable in your expressions
If a post helps to resolve your issue, please accept it as a Solution.
- Mark as New
- Bookmark
- Subscribe
- Mute
- Subscribe to RSS Feed
- Permalink
- Report Inappropriate Content
Thanks Vineeth, This idea really worked.
- « Previous Replies
-
- 1
- 2
- Next Replies »