Unlock a world of possibilities! Login now and discover the exclusive benefits awaiting you.
- Qlik Community
- :
- All Forums
- :
- QlikView App Dev
- :
- Chart with benchmark, how to implement dynamic min...
- Subscribe to RSS Feed
- Mark Topic as New
- Mark Topic as Read
- Float this Topic for Current User
- Bookmark
- Subscribe
- Mute
- Printer Friendly Page
- Mark as New
- Bookmark
- Subscribe
- Mute
- Subscribe to RSS Feed
- Permalink
- Report Inappropriate Content
Chart with benchmark, how to implement dynamic min/max scale for axis
Hello,
I have a chart with an Benchmark calculation as attached.
Due to a better view on the values I try now to implement a dynamic scale in this chart.
I found the example to set static min and static max fields using expressions that take the min/max value of an aggregation.
For example:
Min ( Aggr ( Sum ( valuefield ) , DateTimeField ))
Max ( Aggr ( Sum ( valuefield ) , DateTimeField ))
Source: Scaling dynamic axes on a chart
But if I try to implement this in the attached file it doesn't work?
If anyone has an advice I would be very thankful!
Many thanks and best regards
Claus
Accepted Solutions
- Mark as New
- Bookmark
- Subscribe
- Mute
- Subscribe to RSS Feed
- Permalink
- Report Inappropriate Content
Looking to get this?
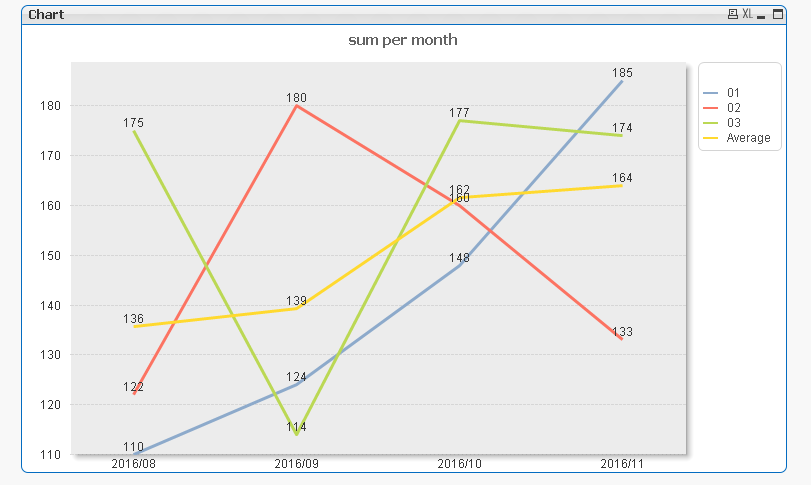
Static Min
=RangeMin(Min(Aggr(Sum({1}SALES), PERIODE, AREA)), Min(Aggr(Avg({1}SALES), PERIODE)))
Static Max
=RangeMax(Max(Aggr(Sum({1}SALES), PERIODE, AREA)), Max(Aggr(Avg({1}SALES), PERIODE)))
- Mark as New
- Bookmark
- Subscribe
- Mute
- Subscribe to RSS Feed
- Permalink
- Report Inappropriate Content
Looking to get this?
Static Min
=RangeMin(Min(Aggr(Sum({1}SALES), PERIODE, AREA)), Min(Aggr(Avg({1}SALES), PERIODE)))
Static Max
=RangeMax(Max(Aggr(Sum({1}SALES), PERIODE, AREA)), Max(Aggr(Avg({1}SALES), PERIODE)))
- Mark as New
- Bookmark
- Subscribe
- Mute
- Subscribe to RSS Feed
- Permalink
- Report Inappropriate Content
Many thanks Sunny,
this is exactly what I searched! 
But for a better view on the min/max values I would use the adjusted formulas.
Best regards,
Claus
Static Min
=RangeMin(Min(Aggr(Sum({1}SALES), PERIODE, AREA)), Min(Aggr(Avg({1}SALES), PERIODE))) *0.9
Static Max
=RangeMax(Max(Aggr(Sum({1}SALES), PERIODE, AREA)), Max(Aggr(Avg({1}SALES), PERIODE))) *1.1
- Mark as New
- Bookmark
- Subscribe
- Mute
- Subscribe to RSS Feed
- Permalink
- Report Inappropriate Content
Awesome