Unlock a world of possibilities! Login now and discover the exclusive benefits awaiting you.
- Qlik Community
- :
- Forums
- :
- Analytics
- :
- New to Qlik Analytics
- :
- How to Map fields combined by comma separator
- Subscribe to RSS Feed
- Mark Topic as New
- Mark Topic as Read
- Float this Topic for Current User
- Bookmark
- Subscribe
- Mute
- Printer Friendly Page
- Mark as New
- Bookmark
- Subscribe
- Mute
- Subscribe to RSS Feed
- Permalink
- Report Inappropriate Content
How to Map fields combined by comma separator
Hi,
I have the following data in Table 1,Table 2 in excel sheet,
Table 1:
| EmployeeID | SkillID | Rating |
| 9 | 1,2,3 | Intermediate |
| 8 | 2,5,1 | Expert |
| 10 | 1,4,3 | Basic |
Table 2:
| SkillID | SkillName |
| 1 | C# |
| 2 | AngularJS |
| 3 | HTML5 |
| 4 | JQuery |
| 5 | QlikView |
From the above two tables we want to map SkillID from Table1 with SkillName in Table2. But the problem is, in Table1 SkillID is combined by 3 fields.
For e.g. EmpoyeeID 9 knows three Skills(C#,AngularJS,HTML5) but all those are combined in same column. So we need to seperate the commas and map them with Table 2 SkillName or is there any way to map without removing those commas with SkillName field?
Regards,
Vijay.M
- « Previous Replies
-
- 1
- 2
- Next Replies »
Accepted Solutions
- Mark as New
- Bookmark
- Subscribe
- Mute
- Subscribe to RSS Feed
- Permalink
- Report Inappropriate Content
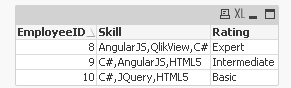
Do you want an output like this?
Try this
MappingTable:
Mapping
LOAD * INLINE [
SkillID, SkillName
1, C#
2, AngularJS
3, HTML5
4, JQuery
5, QlikView
];
Table:
LOAD *,
MapSubString('MappingTable', SkillID) as Skill;
LOAD * INLINE [
EmployeeID, SkillID, Rating
9, "1,2,3", Intermediate
8, "2,5,1", Expert
10, "1,4,3", Basic
];
- Mark as New
- Bookmark
- Subscribe
- Mute
- Subscribe to RSS Feed
- Permalink
- Report Inappropriate Content
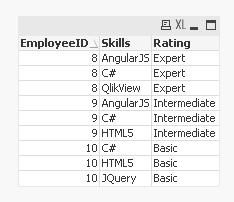
Or this
MappingTable:
Mapping
LOAD * INLINE [
SkillID, SkillName
1, C#
2, AngularJS
3, HTML5
4, JQuery
5, QlikView
];
Table:
LOAD EmployeeID,
ApplyMap('MappingTable', SubField(SkillID, ',')) as Skills,
Rating;
LOAD * INLINE [
EmployeeID, SkillID, Rating
9, "1,2,3", Intermediate
8, "2,5,1", Expert
10, "1,4,3", Basic
];
- Mark as New
- Bookmark
- Subscribe
- Mute
- Subscribe to RSS Feed
- Permalink
- Report Inappropriate Content
thank you @sunny ya i got the expected output its most helpful to me
- Mark as New
- Bookmark
- Subscribe
- Mute
- Subscribe to RSS Feed
- Permalink
- Report Inappropriate Content
hi,
I have pie chart if once i clicked the pie chart it will show gauge chart what condition i need to give
Regards,
Vijay.M
- Mark as New
- Bookmark
- Subscribe
- Mute
- Subscribe to RSS Feed
- Permalink
- Report Inappropriate Content
What is the dimension where you selecting? May be say the field name is Field123, you can try a layout tab condition (for gauge chart) of
=GetSelectedCount(Field123) > 0
- Mark as New
- Bookmark
- Subscribe
- Mute
- Subscribe to RSS Feed
- Permalink
- Report Inappropriate Content
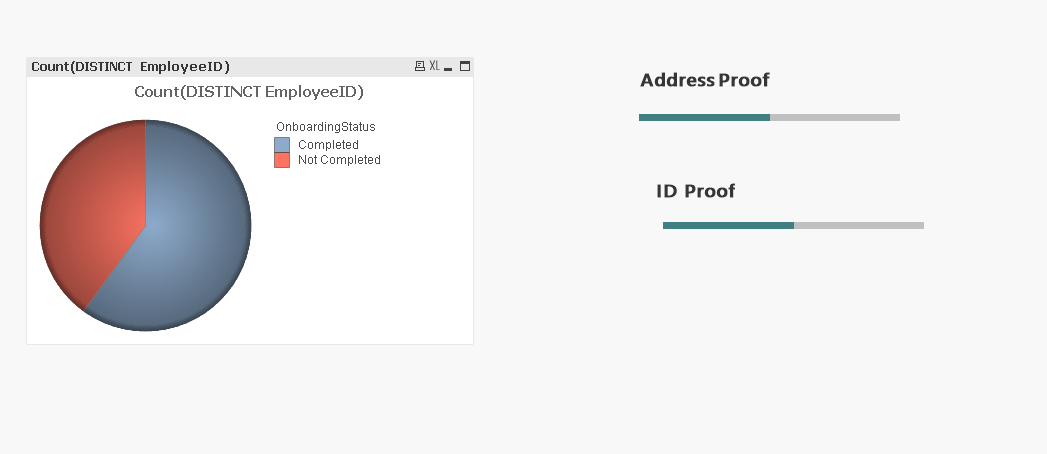
I have a pie chart the chart dimension is a onboardingstatus its shows completed and not completed details if i select completed part it will show addressproof chart or if i select not completed part it will show ID proof chart
- Mark as New
- Bookmark
- Subscribe
- Mute
- Subscribe to RSS Feed
- Permalink
- Report Inappropriate Content
For AddressProof
=onboardingstatus = 'Completed'
For ID Proof
=onboardingstatus = 'Not Completed'
- Mark as New
- Bookmark
- Subscribe
- Mute
- Subscribe to RSS Feed
- Permalink
- Report Inappropriate Content
Hi,
Please give me a solution for this
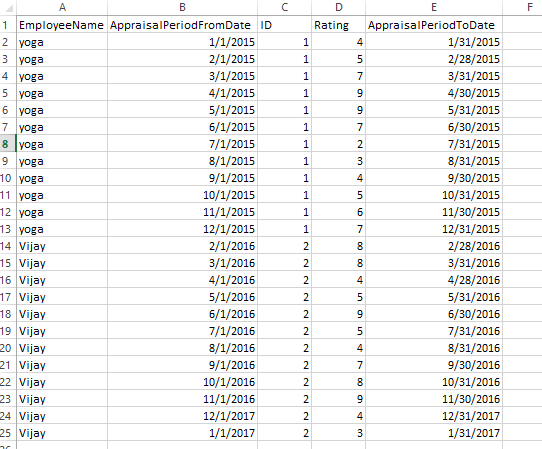
These are the data i have from this I need to find out the current rating and previous rating I have scenarios where I will have many no.of AppraisalDates(AppraisalStartDate,AppraisalEndDate) and I want to calculate the Final Rating by adding up for last 6 months(AppraisalEndDate: 7/12/2017-12/30/2017) as Current Rating and previous 6 months(AppraisalEndDate: 1/31/2017-6/30/2017) as Previous Rating.eg if an employee starts the appraisal date from April(4/30/2016) to March(3/30/2017) i want show first 6 month as previous rating and next 6 months as current rating
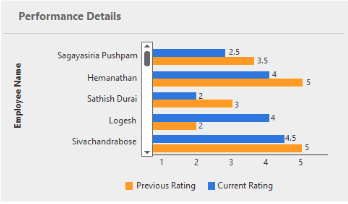
And also I want to show the Start and End Months in chart like 'Jan to June'
Can anyone suggest me how we can do that?
- Mark as New
- Bookmark
- Subscribe
- Mute
- Subscribe to RSS Feed
- Permalink
- Report Inappropriate Content
This seems like a totally unrelated issue to what the thread was meant to be. Do you mind creating a new thread for this new requirement of yours?
- « Previous Replies
-
- 1
- 2
- Next Replies »