Unlock a world of possibilities! Login now and discover the exclusive benefits awaiting you.
- Qlik Community
- :
- Forums
- :
- Analytics
- :
- New to Qlik Analytics
- :
- Re: Fiscal Year/Graph question
- Subscribe to RSS Feed
- Mark Topic as New
- Mark Topic as Read
- Float this Topic for Current User
- Bookmark
- Subscribe
- Mute
- Printer Friendly Page
- Mark as New
- Bookmark
- Subscribe
- Mute
- Subscribe to RSS Feed
- Permalink
- Report Inappropriate Content
Fiscal Year/Graph question
Hi,
I have the following chart which shows unit openings by month:
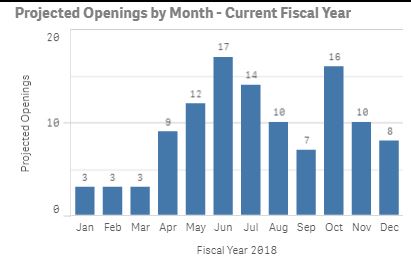
However, our fiscal year begins 1/31/17, so the data shown for Jan above (3 units) actually is January 2018. I'm currently using the expression : =[Opening Date.autoCalendar.Month] as the dimension, and the expression Count(DISTINCT {<[PS Number] = {"=[Opening Date]> '1/31/2017' and [Opening Date]< '1/30/2018'"}>} [PS Number]) as the measure.
I would like the above chart to start in February, then end in Jan (i.e. show January after Dec on the right) to properly show the sequence of months as it relates to our fiscal calendar.
I've searched and read some posts related to defining Fiscal Year on this site, but those posts are confusing.
Can someone please assist? Thanks in advance!
- « Previous Replies
-
- 1
- 2
- Next Replies »
- Mark as New
- Bookmark
- Subscribe
- Mute
- Subscribe to RSS Feed
- Permalink
- Report Inappropriate Content
no worries.
cheers
- Mark as New
- Bookmark
- Subscribe
- Mute
- Subscribe to RSS Feed
- Permalink
- Report Inappropriate Content
Lech,
Just wanted to circle back with you on this.
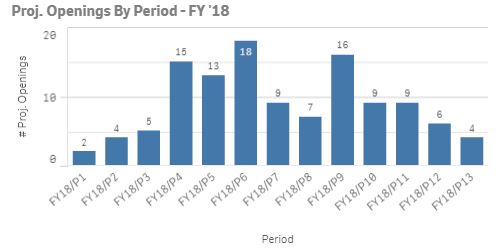
I have another field in my data that lists each location by Opening FY and Period. So, I'm simply going to use that field to graph my data. And it seems to work fine, as shown here:
You have been kind to volunteer your time to help, and just want you to know that I really appreciate it!
- Mark as New
- Bookmark
- Subscribe
- Mute
- Subscribe to RSS Feed
- Permalink
- Report Inappropriate Content
No worries - pleasure to help,
regards
Lech
- « Previous Replies
-
- 1
- 2
- Next Replies »